regl-scatter2d 

Fast and precise 2d scatter plot for lots of points.
Remake on gl-scatter2d, covering other scatter-related components.
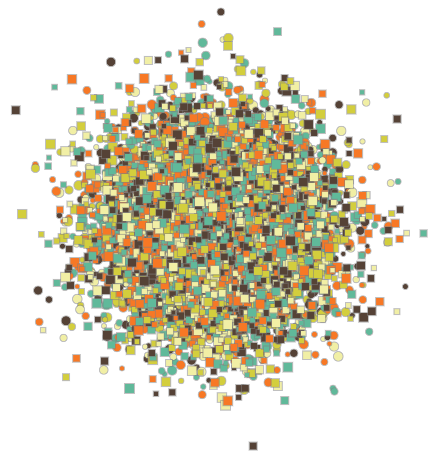
Demo.
Usage

let regl = require('regl')({extensions: 'oes_element_index_uint'})
let createScatter = require('regl-scatter2d')
let scatter = createScatter(regl)
scatter({
positions: [0,0, 1,0, 2,0, 1,1, 2,1],
color: 'rgba(0, 100, 200, .75)'
})
createScatter(regl)
Create new scatter plot instance from regl. regl instance should have OES_element_index_uint extension enabled.
scatter(optionsA, optionsB, ...rest)
Draw scatter points corresponding to options.
scatter(
{ points: [0,0, 1,1], color: 'blue', marker: null },
{ points: [0,1, 1,0], color: 'red', marker: someSdf }
)
| Option | Default | Description |
|---|
positions, points | [] | An array of the unrolled xy coordinates of the points as [x,y, x,y, ...points] or array of points [[x,y], [x,y], ...points]. Can be an object with {x: [...xValues], y: [...yValues]} planar values. For more precise memory control, like in matrix case, x or y can be an object of the form {x: {buffer: reglBuffer, offset: value}}, then the reglBuffer will be reused. |
size, sizes | 12 | Number or array with marker sizes in pixels. Array length should correspond to positions. |
borderSize, borderSizes | 1 | Number or array with border sizes in pixels. Array length should correspond to positions. |
color, colors | 'black' | Color or array with colors. Each color can be a css color string or an array with float 0..1 values. |
borderColor, borderColors | 'transparent' | Border color or array with border colors. |
opacity | 1 | Regulate marker transparency separately from colors. |
marker, markers | null | Marker SDF image, should be a rectangular array with 0..1 1-channel values of signed distance field. Use bitmap-sdf or svg-path-sdf to generate distance array from a canvas, image or svg. .5 value of distance corresponds to the border line. If null, circular marker is used. |
range, dataBox | null | Data bounds limiting visible data as [left, top, right, bottom]. If null, the range is detected as positions boundaries. |
viewport, viewBox | null | Bounding box limiting visible area within the canvas in pixels, can be an array [left, top, right, bottom] or an object {left, top, right, bottom} or {x, y, w, h}. |
snap | null | A bool, number of points threshold to enable snapping or point-cluster tree instance. |
scatter.update(optionsA, optionsB, ...rest)
Update options corresponding to passes, not incurring redraw. Passing null will remove previously loaded pass.
scatter.update(a, b, c)
scatter.update(a, null)
scatter.update(null, b)
scatter.update.apply(scatter, Array.from({length: 10, 9: options}))
scatter.draw(id1|els1?, id2|els2?, ...)
Draw groups corresponding to ids, optionally specify marker ids to draw via els:
scatter.update(
{points: [0,1, 1,0], color: 'red', marker: squareSdf},
{points: [1,2, 2,1], color: 'green', marker: triangleSdf},
{points: [0,0, 1,1], color: 'blue', marker: null}
)
scatter.draw()
scatter.draw(0)
scatter.draw(1, 2)
scatter.draw([1], null, [0])
scatter.destroy()
Dispose scatter instance and associated resources.
Related
Similar
License
© 2017 Dmitry Yv. MIT License
Development supported by plot.ly.


