SurveyJS Analytics


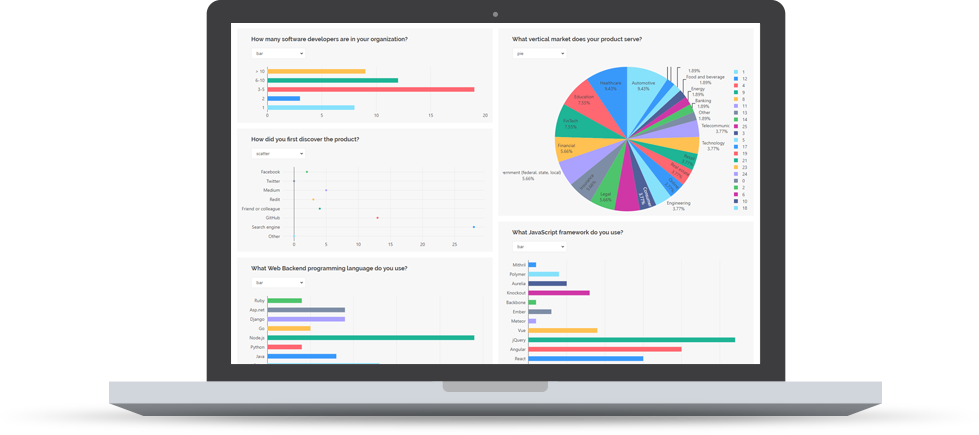
SurveyJS Analytics library allows to render survey results as charts or tables
Main Features
- Count answers and render results as charts for the select type questions
- Count answers and render results as gauge for range type question
- Three different types of charts: bar, pie and line
- Wordcloud for text questions representation
- Interactive filtering for the select type questions
- Flexible layout and customizable colors
Examples
You may review the analytics example or check this standalone plnkr example.
Other live examples:
Licensing
Unlike SurveyJS Library itself, this library is distributed under commercial license. Please read more about licensing on our license page.
Support
If you feel that we have missed some important functionality or found a bug, please write us here on our support desk.
Building survey-analytics from sources
To build library yourself:
-
Clone the repo from GitHub
git clone https://github.com/surveyjs/survey-analytics.git
cd survey-analytics
-
Acquire build dependencies. Make sure you have Node.js installed on your workstation. You need a version of Node.js greater than 6.0.0 and npm greater than 2.7.0. This is only needed to build surveyjs from sources.
npm install
-
Build the library
npm run build_prod
After that you should have the library at 'packages' directory.
-
Run samples
npm start
This command will run local http server at the http://localhost:7777
You can open http://localhost:7777/examples/examples
-
Run unit tests
npm test
This command will run unit tests
Nearest plans
Our task list of Survey Analytics pack:
- Implement data providing server side prototype
- Introduce (or use 3rd party) data processing engine for survey analytics
- Support high load scenario - process at least billion records
Limitations
- SurveyJS Analytics doesn't support objects as values (e.g. of dropdown, radiogroup and other select question items)
- WordCloud visualizer is too slow for large texts and significant answers count


