Product
Introducing Reports: An Extensible Reporting Framework for Socket Data
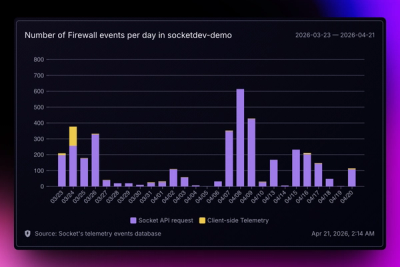
Explore exportable charts for vulnerabilities, dependencies, and usage with Reports, Socket’s new extensible reporting framework.
By André Staltz - Apr 21, 2026
tradex-chart
Advanced tools
TradeX-chart is a highly customizable stock trade chart with **one** dependency written in plain JavaScript; use it with any framework or backend.
TradeX-chart is a highly customizable stock trade chart with one dependency written in plain JavaScript; use it with any framework or backend.

TradeX-chart targets browsers that support ECMAScript 2022.
npm install tradex-chart
<script src="tradex-chart.es.js"></script>
Minimal working example:
<div id="myChartDiv"></div>

<script>

import {Chart, DOM} from 'tradex-chart'
import * as talib from "talib-web"

// minimal data state
let state = {
  "ohlcv": [
// [timestamp, open, high, low, close, volume]
    [1543579200000,4035.6,4072.78348726,3965,4055.6,2157.50135341],
    [1543582800000,4055.6,4100,4035,4059.1719252,1660.6115119],
    [1543586400000,4059.1,4076.6,4014.1,4060,1070.09946267],
    [1543590000000,4060.5,4060.5,3987.2,4049.2,1530.46774287],
    [1543593600000,4049.2,4092.7,4035,4089.6691106,922.84509291]
  ]
}

// minimal config
const config = {
  id: "TradeX_test",
  title: "BTC/USDT",
  width: 1000,
  height: 800,
  utils: {none: true},
  tools: {none: true},
  talib: talib,
  // see configuration.md#config regarding talib.wasm
  // `${window.location.origin}/talib.wasm`
  rangeLimit: 30,
}

const mount = document.getElementById('myChartDiv')
const chart = document.createElement("tradex-chart")

mount.appendChild(chart)
chart.start(config)

</script>
Types provided
Documentation can be found here: Documentation
or built and run locally from the repository by running:
git clone https://github.com/tradex-app/TradeX-chart
cd ./tradex-chart/src/docs
npm run build
Editable sandbox examples can found on CodeSandbox.io
For the latest news on TradeX-chart, feedback, feature requests, and community, join us over on Discord or GitHub.
Testing, bug reports and feature requests welcome
If you have any bugs, issues, or feature requests, please, before making a submission, first:
To submit an issue:
git checkout -b feature/AmazingFeaturegit commit -m 'Add some AmazingFeature'git push origin feature/AmazingFeatureYou can help speed up development by contributing with crypto or PayPal.
if (youEnjoyed) {
    starThisRepository();
}

FAQs
TradeX-chart is a highly customizable stock trade chart with **one** dependency written in plain JavaScript; use it with any framework or backend.
The npm package tradex-chart receives a total of 204 weekly downloads. As such, tradex-chart popularity was classified as not popular.
We found that tradex-chart demonstrated a healthy version release cadence and project activity because the last version was released less than a year ago. It has 1 open source maintainer collaborating on the project.
Did you know?

Socket for GitHub automatically highlights issues in each pull request and monitors the health of all your open source dependencies. Discover the contents of your packages and block harmful activity before you install or update your dependencies.
Product
Explore exportable charts for vulnerabilities, dependencies, and usage with Reports, Socket’s new extensible reporting framework.
Product
Socket for Jira lets teams turn alerts into Jira tickets with manual creation, automated ticketing rules, and two-way sync.

Company News
Socket won two 2026 Reppy Awards from RepVue, ranking in the top 5% of all sales orgs. AE Alexandra Lister shares what it's like to grow a sales career here.