
Research
Security News
Malicious npm Packages Inject SSH Backdoors via Typosquatted Libraries
Socket’s threat research team has detected six malicious npm packages typosquatting popular libraries to insert SSH backdoors.
treechartjs
Advanced tools
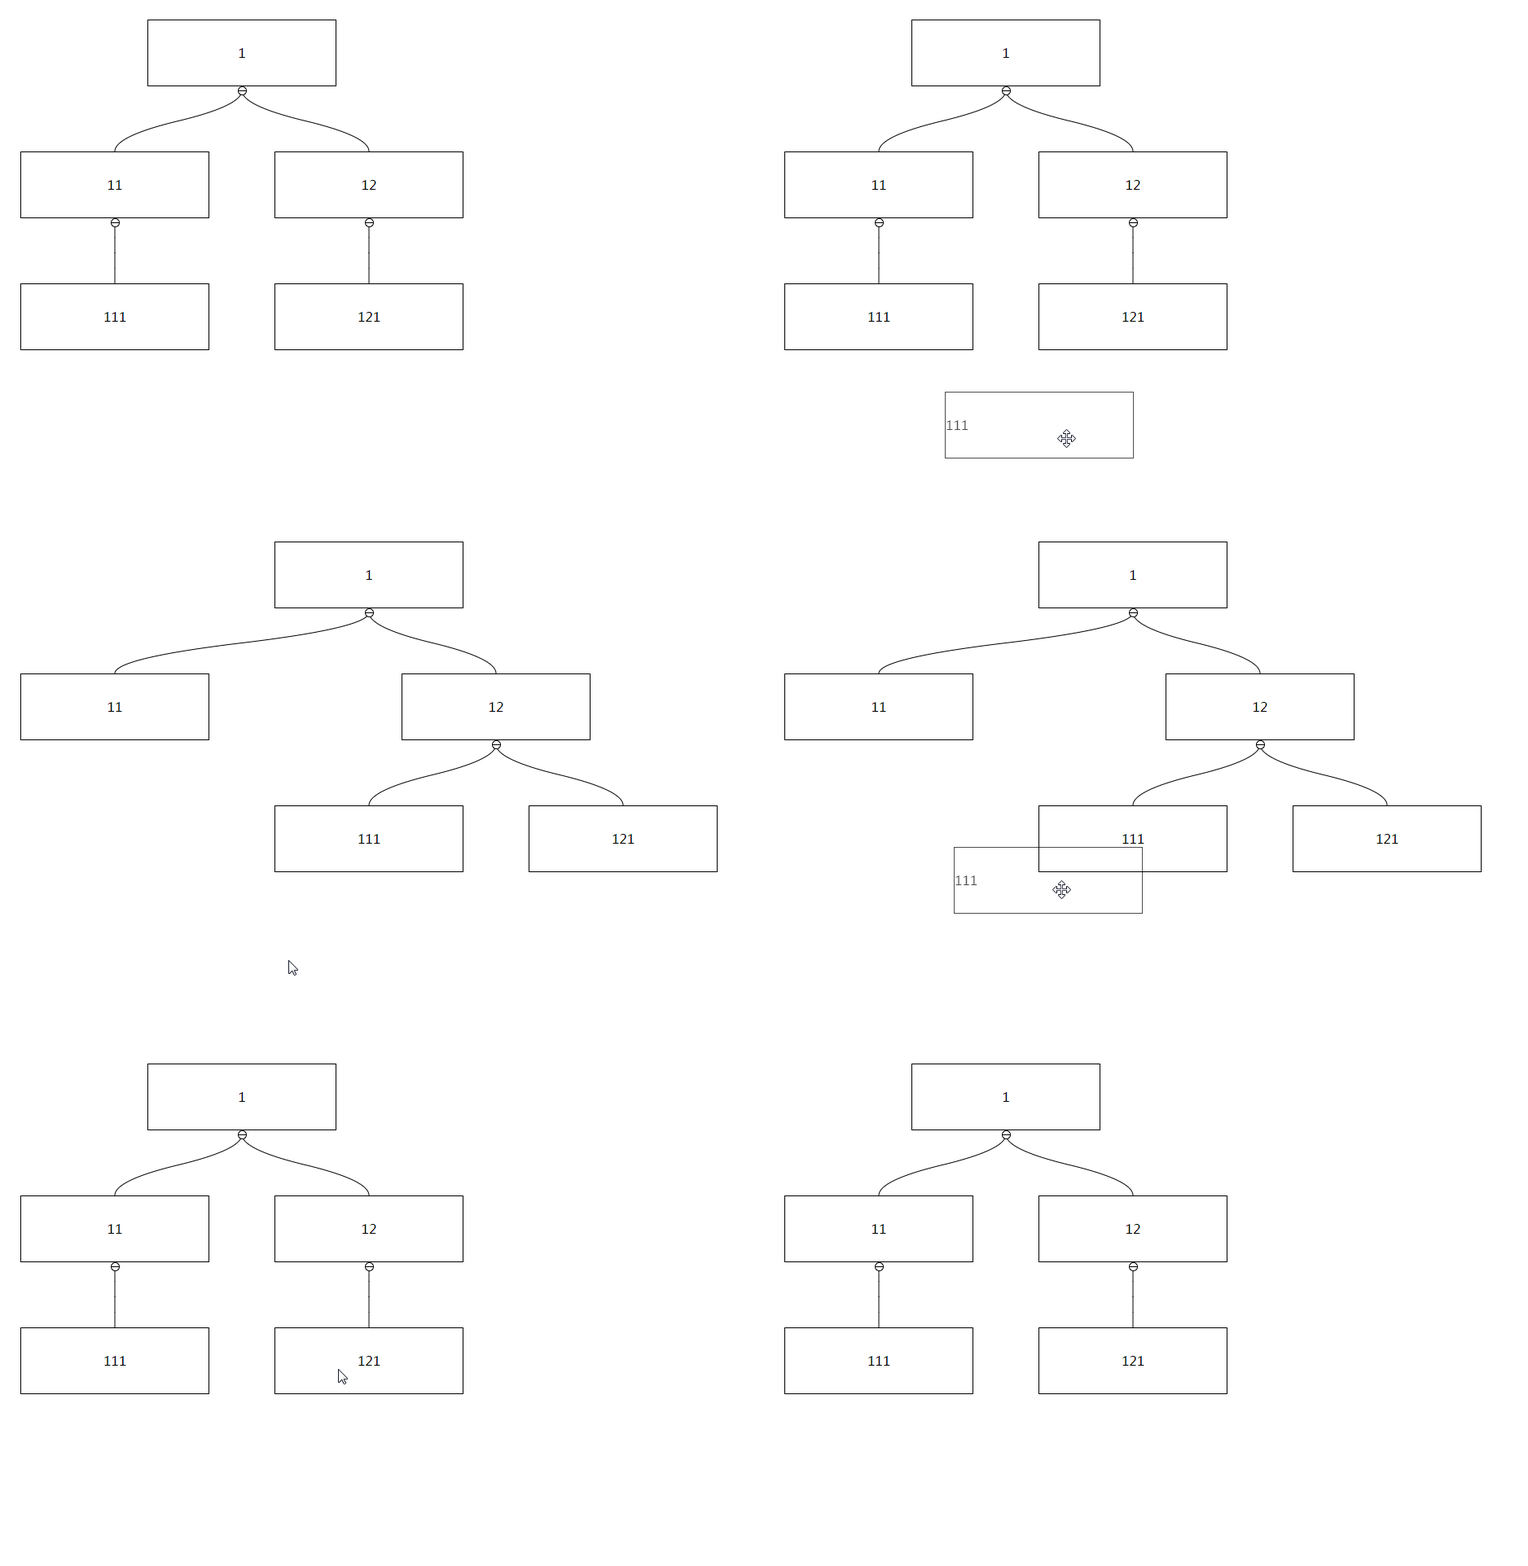
`treechartjs` can generate tree diagrams based on structured data, and supports node expansion/collapse. Nodes can be edited through API or drag-and-drop behavior. Its size is very small and has no dependencies. The size after construction is only 25KB.
treechartjs can generate tree diagrams based on structured data, and supports node expansion/collapse. Nodes can be edited through API or drag-and-drop behavior. Its size is very small and has no dependencies. The size after construction is only 25KB.
[中文文档]
npm install treechartjs
or
yarn add treechartjs
import TreeChart from 'treechartjs'
import 'treechartjs/dist/index.css'

const chart = new TreeChart(...option)
example:
import TreeChart from 'treechartjs'
import 'treechartjs/dist/index.css'

const chart = new TreeChart({
  data: [/*tree data*/],
  container: document.querySelector('.target'), /*chart container HTMLElement*/
  contentRender() {
    /*render function*/
  }
})
Type: String
Default: 'id'
The attribute used to identify the node. The uniqueness of the attribute needs to be guaranteed. If there are duplicate values, it will cause problems in the use process. The value of the attribute must be of type string
Type: Array
Default: undefined
The data source used to render graphics, the format is as follows:
    {
      id: '1',
      children: [{
          id: '11',
          children: [{ id: '111' }]
        }]
    },
Among them, id and children are required, children is an Array type, id can be replaced with the value defined by keyField, and other custom attributes can be added for use by contentRender:
    {
      id: '1',
      name: 'parent',
      age: 45,
      children: [{
          id: '11',
          name: 'son',
          age: 19
        }]
    },
Type: HTMLElement
Default: undefined
The parent element of the chart. After initialization, the class name of tree-chart will be added. If there are too many nodes, you can set overflow: auto to scroll through.
Type: Function
Default: undefined
Custom rendering function can return HTMLElement or HTMLText, and the parameter data is the data corresponding to the node
example:
{
    contentRender(data) {
        const node = document.createElement('div')
        node.innerText = data.name
        return container
    }
}
or
{
    contentRender(data) {
        return `<div class="node-${data.id}">${data.name}</div>`
    }
}
Type: Boolean
Default: true
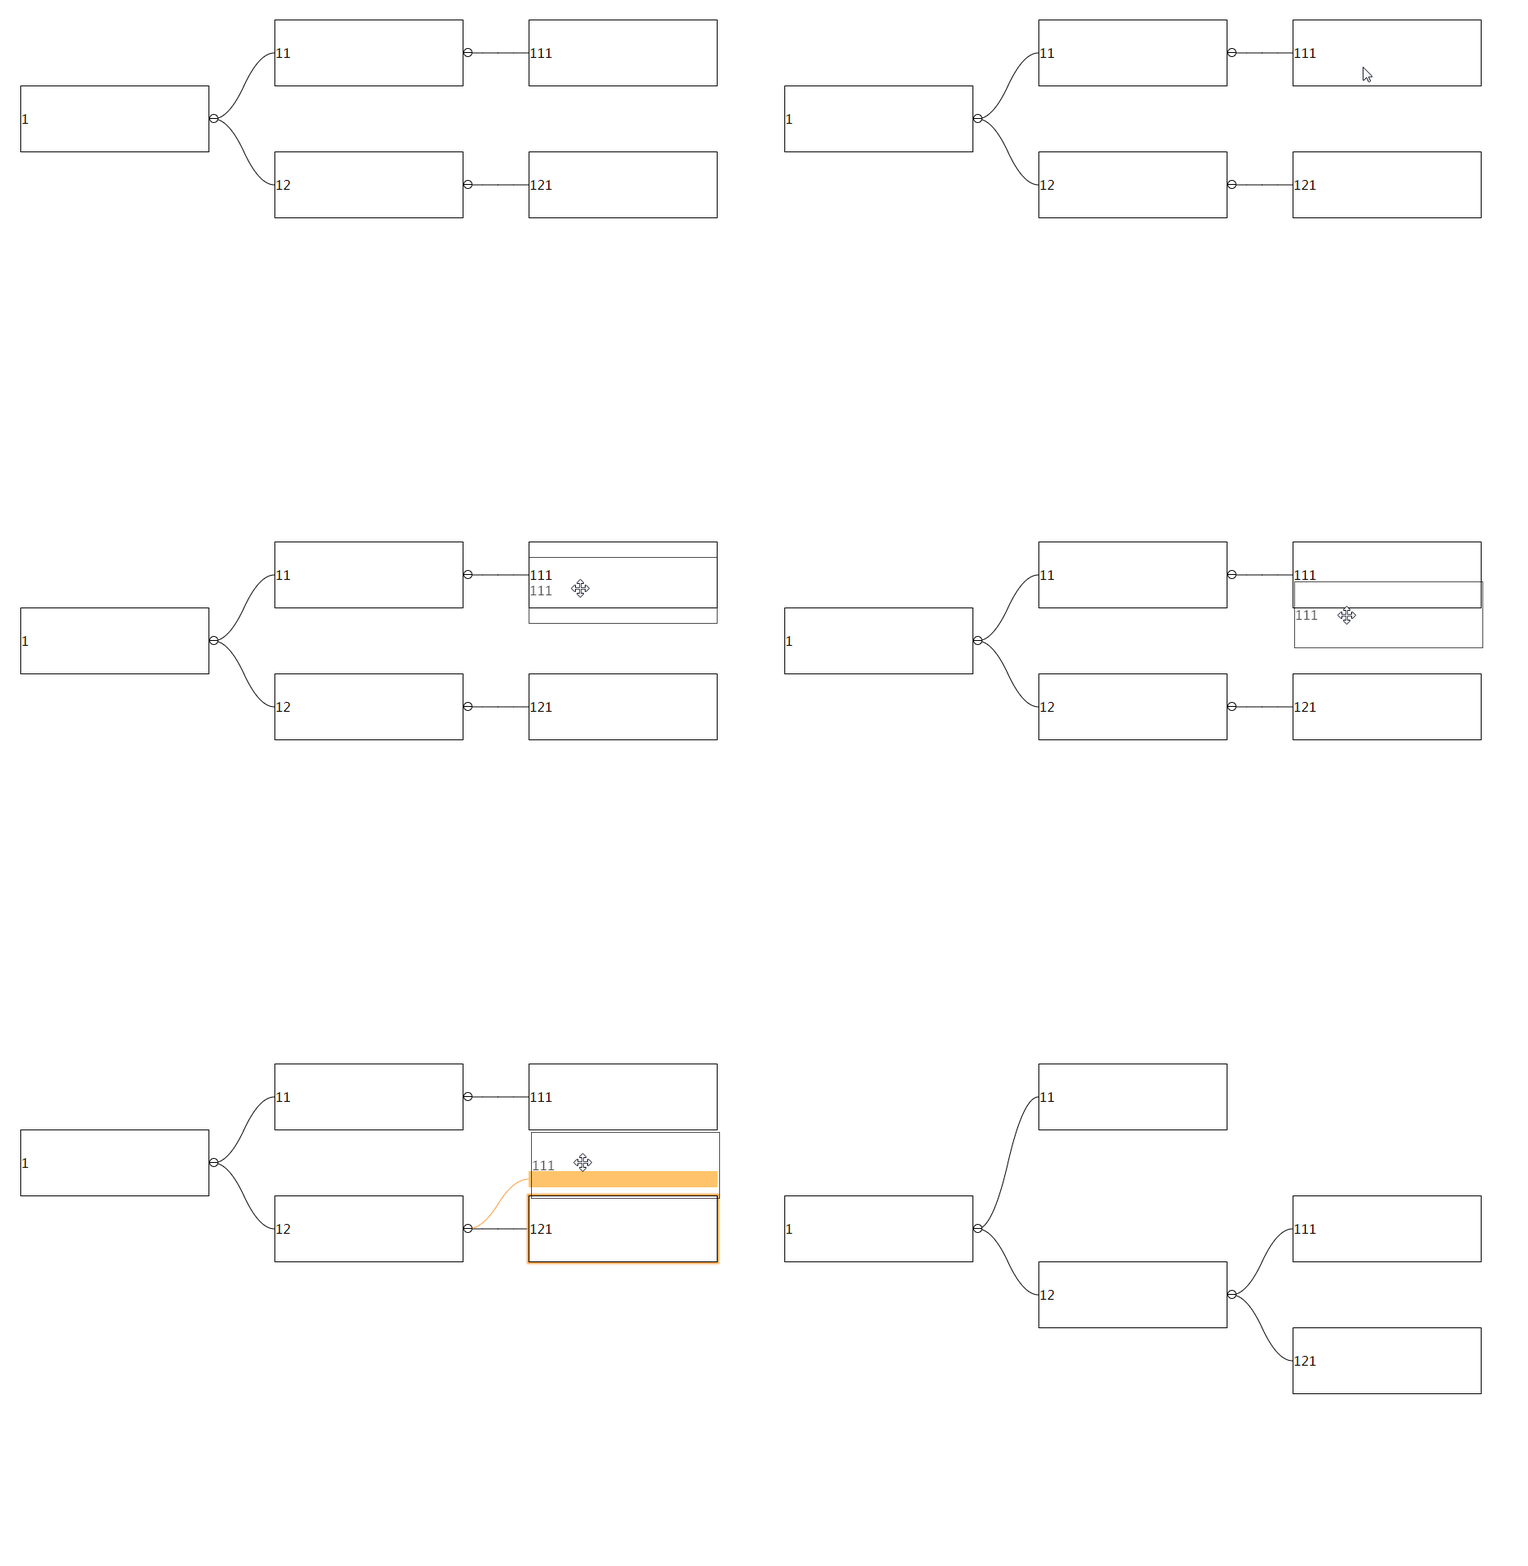
The arrangement direction of the tree, the default arrangement is vertical, if set to false, it will be arranged horizontally:
Type: Number
Default: 40
The horizontal distance between two nodes, this value cannot be less than 40
Type: Number
Default: 40
The vertical distance between two nodes, this value cannot be less than 40
Type: Boolean
Default: false
Whether child nodes can be collapsed, if set to true, they can be expanded and collapsed by clicking or using API
Type: Array
Default: []
Nodes that need to be collapsed in the initial state, if there is a corresponding node in the passed key, the child nodes of the node will be collapsed
Type: Boolean
Default: false
Set to true to enable node dragging function
Type: Boolean
Default: false
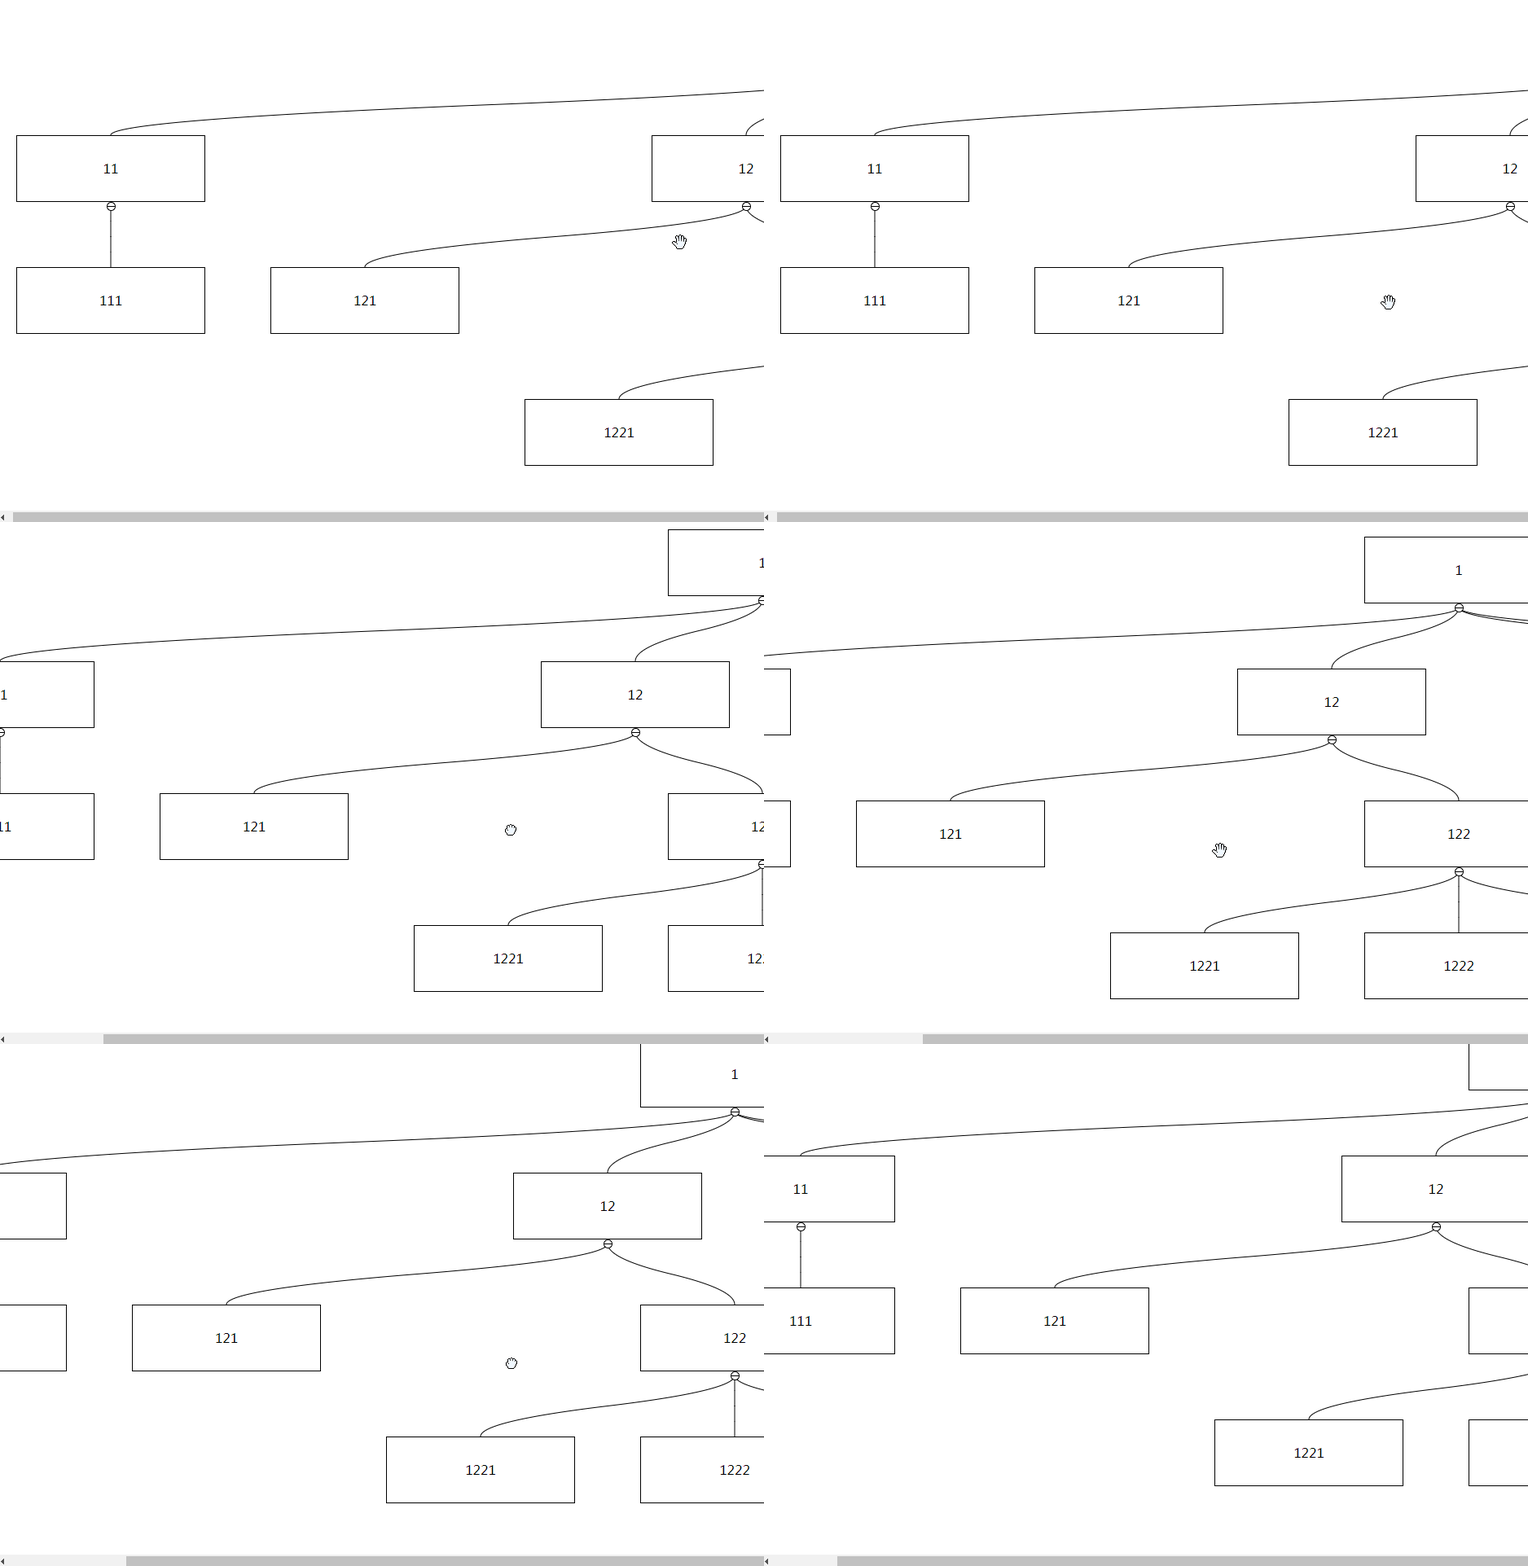
After set to true, you can drag non-node areas to trigger interface scrolling:
Type: Number
Default: 50
If the dragging node is close to the boundary and there are remaining nodes that are not displayed, automatic scrolling will be triggered. By default, the distance between the dragging node and the boundary will be triggered if the distance is less than 50px. This can be changed by setting autoScrollTriggerDistance Critical value, this value must be greater than 0
Type: Object
Default: { type: 'bezier', smooth: 50 }
Set the shape and smoothness of the connecting line between nodes
Type: String
| type | example |
|---|---|
| straight | 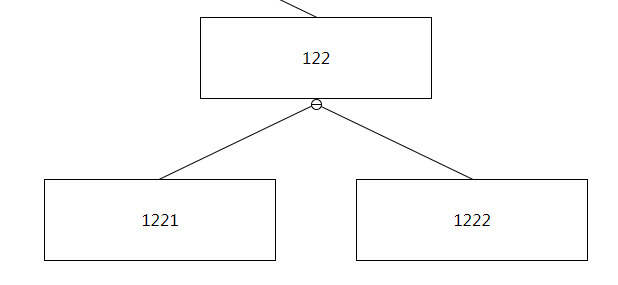 |
| broken | 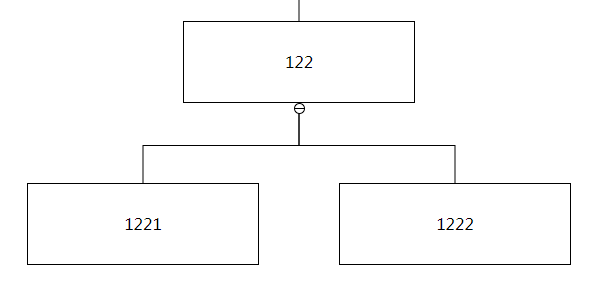 |
| bezier | 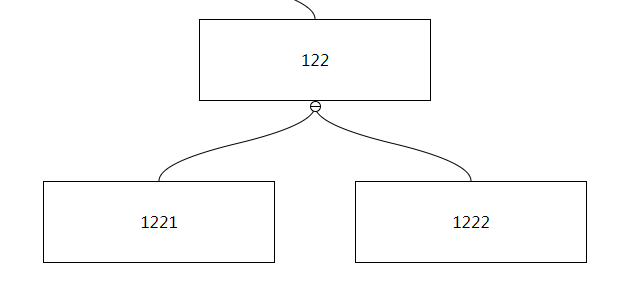 |
Type: Number
Only effective when line.type === bezier, the value is between 0~100, the connecting line will become a straight line when line.smooth === 100
Type: Function
Default: undefined
In the case of option.draggable === true, through option.nodeControl you can control whether the node can be dragged and inserted into child nodes or adjacent nodes
{
    nodeControl(data) {
        return {
              draggable: true, // The target node can be dragged
              insertChild: true, // The target node can insert child nodes
              insertPrevious: true, // The target node can be inserted into PreviousNode
              insertNext: true // The target node can be inserted into NextNode
        }
    }
}
Make the node with ʻid === 1` unable to be dragged:
{
    nodeControl(data) {
        return {
            draggable: data.id !== 1
        }
    }
}
Note: nodeControl can only limit the dragging behavior of the mouse, but not the chart.insertNode method
Type: Function
Default: undefined
In the case of option.draggable === true, option.preventDrag will be triggered before the node is dragged. If the return value is true, the drag of the current node will be prevented. Unlike option.nodeControl, option.nodeControl will only be executed during the initialization phase, but option.preventDrag will be executed before each drag.
Make the node with id === 1 blocked before dragging:
{
    preventDrag(data) {
        return  data.id === 1
    }
}
Type: Function
Default: undefined
The option.dragStart method will be triggered when the dragging behavior of the node starts
{
    dragStart(params) {
        console.log(data) // { element, key }
    }
}
Type: Function
Default: undefined
The dragging behavior of the node stops and the position change will trigger the option.dragEnd method
{
    dragEnd(params) {
        console.log(params) // { key, target, type, from, to }
    }
}
params.key: the key representing the node being dragged
params.target: the key representing the target node (the node that was collided)
params.type: possible values are: previous, next and child
params.from and params.to: represents the location information before and after the node moves
Type: Function
Default: undefined
The option.click method will be triggered when the node is clicked
{
    click(params) {
        console.log(params) // { element, key }
    }
}
Type: Function
Default: undefined
The option.mouseEnter method will be triggered when the mouse enters the node area
{
    mouseEnter(params) {
        console.log(params) // { element, key }
    }
}
Type: Function
Default: undefined
The option.mouseLeave method will be triggered when the mouse leaves the node area
{
    mouseLeave(params) {
        console.log(params) // { element, key }
    }
}
getNodeElement(nodeKey: string): string
Get the element corresponding to the node according to the passed nodeKey
chart.getNodeElement('1') // HTMLElement
getKeyByElement(nodeElement: HTMLElement): HTMLElement
Get the nodeKey corresponding to the nodeElement node
chart.getKeyByElement(document.querySelector('.tree-chart-item-1')) // nodeKey: 1
getPreviousKey(nodeKey: string): string
Get the nodeKey of the previous sibling node according to the passed nodeKey
chart.getKeyByElement('3') // nodeKey: 2
getNextKey(nodeKey: string): string
Obtain the nodeKey of the next sibling node according to the passed nodeKey
chart.getNextKey('2') // nodeKey: 3
getParentKey(nodeKey: string): string
Get the nodeKey of the parent node according to the passed nodeKey
chart.getNextKey('2') // nodeKey: 1
getChildrenKeys(nodeKey: string): Array<string>
Get the nodeKey list of the child nodes according to the passed nodeKey. Note that only the nodeKey of the first-level child nodes are returned here.
chart.getChildrenKeys('1') // nodeKeys: ['1', '2']
existChildren(nodeKey: string): boolean
Determine whether the node corresponding to nodeKey has child nodes
chart.existChildren('1') // true
insertNode(targetKey: string, origin: string | object, type: string): void
The
nodeKeyof the target node, this node is not the node that needs to be moved
The parameter value can be
nodeKeyorobject. If it isnodeKey, it represents the node that needs to be operated. If it isobject, a new node will be created for operation. The format ofobjectshould beoption.dataA child of
The possible values are
child,previousandnext, which represent insert as a child node, insert as the previous sibling node, and insert as the next sibling node, respectively
You can add new nodes or move existing nodes through insertNode
chart.insertNode('1', '2', 'child') // Insert the node with key 2 as a child node of 1
chart.insertNode('1', '2', 'previous') // Insert the node with key 2 as the previous sibling node of 1
chart.insertNode('1', '2', 'next') // Insert the node with key 2 as the next sibling node of 1

const newNodeData = {
    id: '8',
    name: 'jack',
    age: 24
}
chart.insertNode('1', newNodeData, 'child') // Create a new child node for the node with key 1
Note: Under no circumstances can you insert a sibling node to the root node
removeNode(nodeKey: string): void
Delete the node corresponding to nodeKey
chart.removeNode('3') // The node with key 3 is deleted
nodeIsFold(nodeKey: string): boolean
Determine whether the corresponding node is collapsed according to the passed nodeKey
chart.nodeIsFold('2') // false
toggleFold(nodeKey: string): void
The node corresponding to nodeKey will change the collapsed state
chart.toggleFold('2')
reRenderNode(nodeKey: string, nodeData: object): void
Re-render the target node according to the incoming nodeData
const nodeData = {
    id: '2',
    name: 'jeck',
    age: 32
}
chart.reRenderNode('2', nodeData) // The node with key 2 is re-rendered
reloadLink(): void
Re-render all the connecting lines in the chart
chart.reloadLink()
reRender(data: object): void
Use the new data to render the entire chart, the format of data should be consistent with option.data
const data = {
      id: '1',
      children: [{
          id: '11',
          children: [{ id: '111' }]
        }]
    }

chart.reRender(data)
FAQs
Generate tree chart based on structured data, and support node expansion/collapse, and edit nodes through API or drag-and-drop behavior
The npm package treechartjs receives a total of 3 weekly downloads. As such, treechartjs popularity was classified as not popular.
We found that treechartjs demonstrated a not healthy version release cadence and project activity because the last version was released a year ago. It has 1 open source maintainer collaborating on the project.
Did you know?

Socket for GitHub automatically highlights issues in each pull request and monitors the health of all your open source dependencies. Discover the contents of your packages and block harmful activity before you install or update your dependencies.

Research
Security News
Socket’s threat research team has detected six malicious npm packages typosquatting popular libraries to insert SSH backdoors.

Security News
MITRE's 2024 CWE Top 25 highlights critical software vulnerabilities like XSS, SQL Injection, and CSRF, reflecting shifts due to a refined ranking methodology.

Security News
In this segment of the Risky Business podcast, Feross Aboukhadijeh and Patrick Gray discuss the challenges of tracking malware discovered in open source softare.