Security News
Deno 2.2 Improves Dependency Management and Expands Node.js Compatibility
Deno 2.2 enhances Node.js compatibility, improves dependency management, adds OpenTelemetry support, and expands linting and task automation for developers.

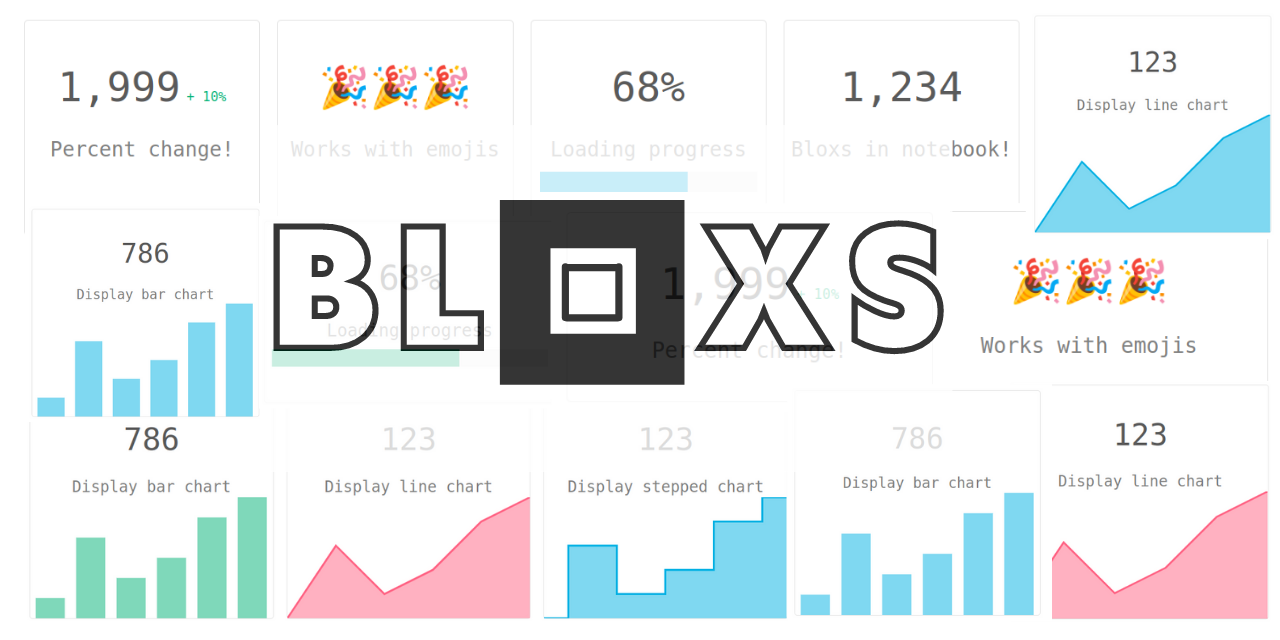
Bloxs is a simple python package that helps you display information in an attractive way (formed in blocks). Perfect for building dashboards, reports and apps in the notebook.
It works with: Jupyter Notebook, Google Colab, Deepnote, Kaggle Notebook, Mercury.

Install bloxs:
pip install bloxs
Import and create a bloxs:
from bloxs import B
B(1234, "Bloxs in notebook!")

| Bloxs | Code |
|---|---|
 | B(1234, "Bloxs in notebook!") |
 | B(1999, "Percent change!", percent_change=10) |
 | B("🎉🎉🎉", "Works with emojis") |
 | B("68%", "Loading progress", progress=68) |
 | B("68%", "Loading progress", progress=68, color="green") color can be "blue", "red", "green" or custom in hex format (exmaple "#fa33fa") |
 | B("123", "Display line chart", points=[1,4,2,3,5,6]) |
 | B("123", "Display line chart", points=[1,4,2,3,5,6], color="red") |
 | B("123", "Display stepped chart", points=[1,4,2,3,5,6], chart_type="stepped") |
 | B("123", "Display bar chart", points=[1,4,2,3,5,6], chart_type="bar") |
 | B("123", "Display bar chart", points=[1,4,2,3,5,6], chart_type="bar", color="green") |
You can combine several bloxs in one row:
B([
    B(1999, "Percent change!", percent_change=10),
    B("🎉🎉🎉", "Works with emojis"),
    B("68%", "Loading progress", progress=68),
    B(1234, "Bloxs in notebook!")
])

B([
    B("786", "Display bar chart", points=[1,4,2,3,5,6], chart_type="bar", color="green"),
    B("123", "Display line chart", points=[1,4,2,3,5,6], color="red"),
    B("123", "Display stepped chart", points=[1,4,2,3,5,6], chart_type="stepped")
])

:computer: You can check the notebook with above example bloxs.
Mercury is a framework for converting notebook to an interactive web app. It adds widgets to the notebook based on the YAML config. Below is presented a notebook with bloxs and the same notebook served as a web app with Mercury.


The web app is available on our server :computer:

FAQs
Display data in an attractive way
We found that bloxs demonstrated a healthy version release cadence and project activity because the last version was released less than a year ago. It has 1 open source maintainer collaborating on the project.
Did you know?

Socket for GitHub automatically highlights issues in each pull request and monitors the health of all your open source dependencies. Discover the contents of your packages and block harmful activity before you install or update your dependencies.

Security News
Deno 2.2 enhances Node.js compatibility, improves dependency management, adds OpenTelemetry support, and expands linting and task automation for developers.

Security News
React's CRA deprecation announcement sparked community criticism over framework recommendations, leading to quick updates acknowledging build tools like Vite as valid alternatives.

Security News
Ransomware payment rates hit an all-time low in 2024 as law enforcement crackdowns, stronger defenses, and shifting policies make attacks riskier and less profitable.