Security News
Create React App Officially Deprecated Amid React 19 Compatibility Issues
Create React App is officially deprecated due to React 19 issues and lack of maintenance—developers should switch to Vite or other modern alternatives.
sees
Highly efficient and portable finite element visualization framework
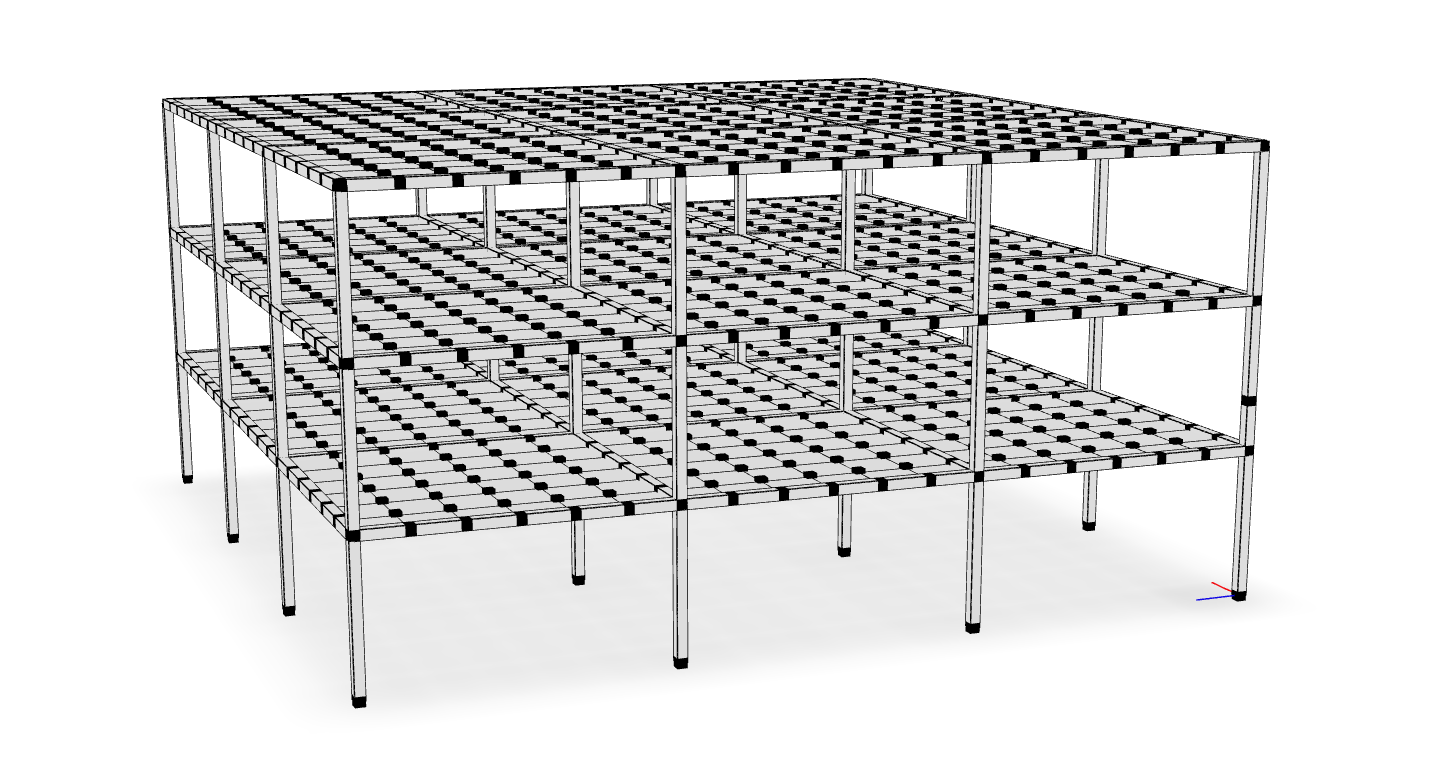
sees is a finite element rendering library that leverages modern
web technologies to produce sharable, efficient, and beautiful renderings.
Documentation is currently under development.
Render frames with extruded cross sections
Detailed section rendering
A wide selection of rendering backends and output file types, including
optimized 3D web formats like .glb.
Correctly render models that treat both y or z as the
vertical coordinate.
To create a rendering, execute the following command from the anaconda prompt (after activating the appropriate environment):
python -m sees model.json -o model.html
where model.json is a JSON file generated from executing the following OpenSees command:
print -JSON model.json
If you omit the -o <file.html> portion, it will plot immediately in a new
window. You can also use a .png extension to save a static image file, as
opposed to the interactive html.
Note Printing depends on the JSON output of a model. Several materials and elements in the OpenSeesPy and upstream OpenSees implementations do not correctly print to JSON. For the most reliable results, use the
openseespackage.
By default, the rendering treats the $y$ coordinate as vertical.
In order to manually control this behavior, pass the option
--vert 3 to render model $z$ vertically, or --vert 2 to render model $y$ vertically.
If the opensees package is installed,
you can directly render a Tcl script without first printing to JSON,
by just passing a Tcl script instead of the JSON file:
python -m sees model.tcl -o model.html
To plot an elevation (elev) plan (plan) or section (sect) view, run:
python -m sees model.json --view elev
and add -o <file.extension> as appropriate.
To see the help page run
python -m sees --help
See also
The sees packages was used to generate figures for the following publications:

|

|
|
FAQs
Bridge information modeling
We found that cnvr demonstrated a healthy version release cadence and project activity because the last version was released less than a year ago. It has 1 open source maintainer collaborating on the project.
Did you know?

Socket for GitHub automatically highlights issues in each pull request and monitors the health of all your open source dependencies. Discover the contents of your packages and block harmful activity before you install or update your dependencies.

Security News
Create React App is officially deprecated due to React 19 issues and lack of maintenance—developers should switch to Vite or other modern alternatives.

Security News
Oracle seeks to dismiss fraud claims in the JavaScript trademark dispute, delaying the case and avoiding questions about its right to the name.

Security News
The Linux Foundation is warning open source developers that compliance with global sanctions is mandatory, highlighting legal risks and restrictions on contributions.