Security News
Fluent Assertions Faces Backlash After Abandoning Open Source Licensing
Fluent Assertions is facing backlash after dropping the Apache license for a commercial model, leaving users blindsided and questioning contributor rights.
Plot complex-valued functions with style.
cplot helps plotting complex-valued functions in a visually appealing manner.
Install with
pip install cplot
and use as
import numpy as np

import cplot


def f(z):
    return np.sin(z**3) / z


plt = cplot.plot(
    f,
    (-2.0, +2.0, 400),
    (-2.0, +2.0, 400),
    # abs_scaling=lambda x: x / (x + 1),  # how to scale the lightness in domain coloring
    # contours_abs=2.0,
    # contours_arg=(-np.pi / 2, 0, np.pi / 2, np.pi),
    # emphasize_abs_contour_1: bool = True,
    # add_colorbars: bool = True,
    # add_axes_labels: bool = True,
    # saturation_adjustment: float = 1.28,
    # min_contour_length = None,
    # linewidth = None,
)
plt.show()
Historically, plotting of complex functions was in one of three ways
| Only show the absolute value; sometimes as a 3D plot | Only show the phase/the argument in a color wheel (phase portrait) | Show contour lines for both arg and abs |
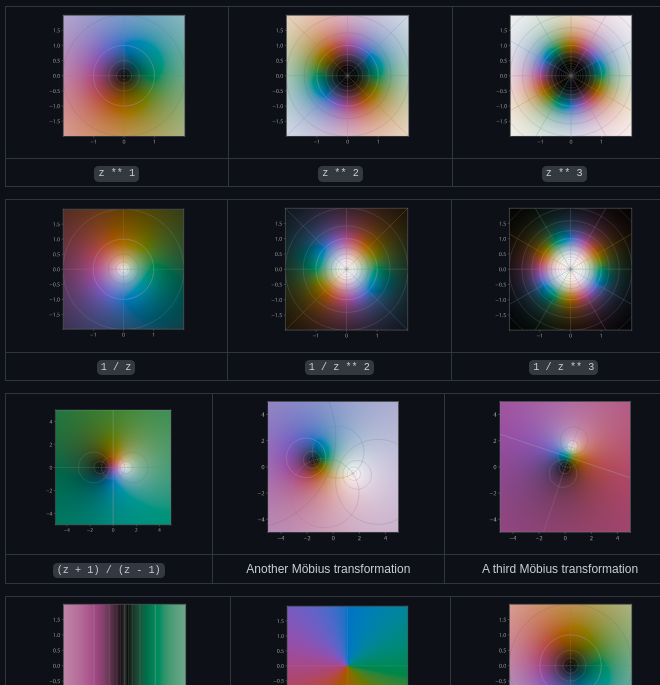
Combining all three of them gives you a cplot:
See also Wikipedia: Domain coloring.
Features of this software:
abs(z) == 1 is emphasized, other abs contours are at 2, 4, 8, etc. and
1/2, 1/4, 1/8, etc., respectively. This makes it easy to tell the absolte value
precisely.arg(z) == 0, the color is green, for arg(z) == pi/2 it's blue, for arg(z) = -pi / 2 it's orange, and for arg(z) = pi it's pink.Other useful functions:
# There is a tripcolor function as well for triangulated 2D domains
cplot.tripcolor(triang, z)

# The function get_srgb1 returns the SRGB1 triple for every complex input value.
# (Accepts arrays, too.)
z = 2 + 5j
val = cplot.get_srgb1(z)

cplot can also plot functions on the Riemann sphere, a mapping of the complex plane to the unit ball.
import cplot
import numpy as np

cplot.riemann_sphere(np.log)

To run the cplot unit tests, check out this repository and run
tox
This software is published under the GPL-3.0 license. In cases where the constraints of the GPL prevent you from using this software, feel free contact the author.
FAQs
Plot complex-valued functions
We found that cplot demonstrated a healthy version release cadence and project activity because the last version was released less than a year ago. It has 1 open source maintainer collaborating on the project.
Did you know?

Socket for GitHub automatically highlights issues in each pull request and monitors the health of all your open source dependencies. Discover the contents of your packages and block harmful activity before you install or update your dependencies.

Security News
Fluent Assertions is facing backlash after dropping the Apache license for a commercial model, leaving users blindsided and questioning contributor rights.

Research
Security News
Socket researchers uncover the risks of a malicious Python package targeting Discord developers.

Security News
The UK is proposing a bold ban on ransomware payments by public entities to disrupt cybercrime, protect critical services, and lead global cybersecurity efforts.