Product
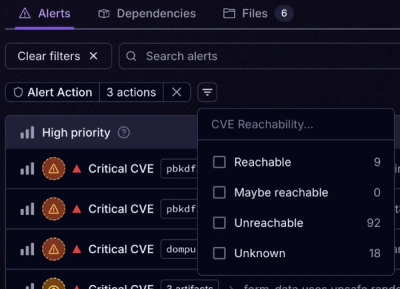
Introducing Tier 1 Reachability: Precision CVE Triage for Enterprise Teams
Socket’s new Tier 1 Reachability filters out up to 80% of irrelevant CVEs, so security teams can focus on the vulnerabilities that matter.
ddebug is a python library with a set of tools for simple debugging of python progams. It works only within a python file, not in the console.
ddebug is both icecream, snoop and rich.
ddebug works with python 3.6+.
Install using pip: (python -m) pip install ddebug[full].
if you want only the main dependencies (without dd.watch,dd.diff,pdbr and inputtimeout) you can install with pip install ddebug.
if you want all but the special pdb post (pdbr and input with timeout) in excepthook you can install with pip install ddebug[no-pdbr].
from ddebug import dd
@dd  # do @snoop on a function
def foo(n):
    return n + 333
@dd  # do @snoop on all class functions (only possible in ddebug)
class A:
    def bar(self, n):
        return n + 333

dd(A().bar(foo(123)))  # use like icecream.
output:
12:00:00.00 >>> Call to foo in File "python file.py", line 3
12:00:00.00 ...... n = 123
12:00:00.00    3 | def foo(n):
12:00:00.00    4 |     return n + 333
12:00:00.00 <<< Return value from foo: 456
12:00:00.00 >>> Call to A.bar in File "python file.py", line 7
12:00:00.00 .......... self = <__main__.A object at 0x04F64E80>
12:00:00.00 .......... n = 456
12:00:00.00    7 |     def bar(self, n):
12:00:00.00    8 |         return n + 333
12:00:00.00 <<< Return value from A.bar: 789
dd| A().bar(foo(123)): 789
In ddebug there is an option for more detailed (and more beautiful) traceback than the regular traceback:
from ddebug import dd
#place at start of program
dd.set_excepthook()
Then when an error occurrs ddebug creates a file named <file>-errors.txt:
the file starts with rich (render Python tracebacks with syntax highlighting and formatting)
and then friendly explanation of the error.
and ddebug will print all this file in colors.
In addition, you can press Enter within the first 5 seconds after exception and it will open the pdbr debugger. if pdbr has a error, ddebug will start standard pdb.

If you don't want\can't use excepthook (because usually other modules use the excepthook), you can use atexit:
from ddebug import dd
dd.set_atexit()
if you want to choose file name:
pass file=<file> to the function.
if you want ddebug only print to console (without file):
pass with_file=False to the function.
you can control ddebug usage of pdbr debugger automatically with system variable ddebug_pdb:
set ddebug_pdb=1 to set the input always to True
set ddebug_pdb=0 to set the input always to False
set ddebug_pdb=None or delete ddebug_pdb to not set the input
note: ddebug will ask for input only in real console (e.g. for windows: cmd.exe). and not in piped terminal (for windows:pycharm run python files)
modify/Create {python_path}\sitecustomize.py
for windows is usually: %LocalAppData%\Programs\Python\Python38-32 or if you have python 3.9 %LocalAppData%\Programs\Python\Python39
for linux and macos is usually:/usr/lib/python3.X/ where X is your python minor version
try:
    from ddebug import dd
except ImportError:
    pass
else:
    __builtins__['dd'] = dd
and then you can just use dd without do from ddebug import dd
ddebug has a beautiful debug tool for print stack (to see the current stack without raising an error):

just do:
from ddebug import dd
#  print stack like traceback
dd.print_stack()
# print stack like traceback only last 3 calls
dd.print_stack(block=3)
you can also use ddebug traceback (without pdbr and the files) in try/except:
from ddebug import dd
try:
    1/0
except Exception:
    dd.print_exception()
ddebug also has shortcut for this using log_error (named also except_error):
with dd.log_error():
    1/0
or in function:
@dd.log_error_function # named also except_error_function
def test():
    return 1/0
test()
ddebug also has shortcut that connects all of the print_exception shortcut named exc.
you can use it as normal print_exception (by dd.exc()),log_error (by @dd.exc) and log_error_function (by with dd.exc)
ddebug has a watch and unwatch (named also w and unw) using watchpoints.
from ddebug import dd
a = []
dd.watch(a)
a = {}
Output
Watch trigger ::: File "python-file.py", line 4, in <module>
a:was [] is now {}
By default all of this output is printed to sys.stderr.
If you want to change this, do:
from ddebug import dd
import sys
dd.watch_stream = sys.stdout # or another file/stream as you want
You can config snoop common arguments with dd.snoop_short_config (named also ssc) with:
from ddebug import dd
dd.snoop_short_config(watch=('foo.bar', 'self.x["whatever"]'),watch_explode=['foo', 'self'])
@dd.ssc(watch=('foo.bar', 'self.x["whatever"]'))   # you even use that as the @dd
def foo(n):
  return n+333
foo(123)
ddebug can show difference bitween two objects using deepdiff (ddebug also formats this using rich):

Sometimes you don't want to view all the class functions internal processes, just see when it was called. Then you can use mincls(named also mc) option to just see the function call:
from ddebug import dd
@dd.mincls
class A:
    def a(self):
        pass

a = A()
a.a()
Output:
dd| python-file.py:8 in <module>: call method 'a' from class 'A' at 11:34:15.383
mincls does not yet support the __ <> __ functions(e.g. __ init __).
ddebug can run function in loop and return|print the average time by the timeit command (named also dd.time):
from ddebug import dd
@dd.timeit()
def f(a, b):
    a + b
f(2,2)
Output:
0.100000000 - timeit on function f - (running 1000000 times)
ddebug can print all locals in colors by the command:
from ddebug import dd
a = "ddebug"
b = "-"
c = "locals"
dd.locals()
If you use ddebug as a function like icecream, e.g. dd(value) it will return the arguments you passed in to it:
from ddebug import dd
a = "a"
b = "b"
c = dd(dd(a)+dd(b))
dd(c)
Output:
dd| a: 'a'
dd| b: 'b'
dd| dd(a)+dd(b): 'ab'
dd| c: 'ab'
dd has a lot of operations that are equal to dd(a):
from ddebug import dd
a = "a"
b = dd+a
b = dd*a
b = dd@a
b = dd>>a
b = dd<<a
b = a|dd
b = dd|a
b = dd&a
for example: instead of trying to add dd() to l = list(map(str,filter(bool,range(12))))
you can do l = dd @ list(map(str,filter(bool,range(12))))
Don't use <>=(e.g. +=) operations. icecream can't get source code and will throw a ScoreError.
To make dd available in every file (without needing to import ddebug) just write in the first file:
from ddebug import dd
dd.install() # install only "dd" name
# you can chose an alias
dd.install(("dd","d"))
dd has an attribute named enabled. Set to false to suppress output.
from ddebug import dd
dd(12) # will output ic(12)
dd.enabled = False
dd(12) # not output anything
This disabes all ddebug tools except for the dd-tracebacks.
If you want to write ddebug output to tmp file (like q) and also to stderr just do:
dd.add_tmp_stream()
If you want only a tmp file(without stderr):
dd.add_tmp_stream(with_print=False)
if you want to write only to custom file do:
dd.stream = open("output.txt","w")
Don't forget to close the file.
If you do not close the file - the file will probably not write.
My recommendation is to use built-inatexit module to close the file (you can use it even if you alredy use atexit (e.g. dd.set_atexit()):
import atexit
from ddebug import dd
output_stream = open("output.txt", "w")
atexit.register(output_stream.close) #will close the file at the end of the program
dd.stream = output_stream
All of them will remove color from stderr print.
All of them will affect all ddebug tools except the Tracebacks.
If you want to see all the output of ddebug in one folder you can do:
from ddebug import dd
dd.add_output_folder()  # then all output goes to folder and stderr - it will also remove color.
it will create a folder named <file>_log and create 4 .txt files:
watch-log - output from dd.<un>watchsnoop-log - output from @dd on class or function and from dd.deepicecream-log - output from dd() and @dd.mincls.rich-log - output from dd.pprint,dd.inspect,dd.diff and dd.print_stack()It will also set excepthook or atexit to create a file named error.txt in this folder.
Pass with_errors=False to this function to prevent this.
If you dont want each run of the program to overwrite the files in the folder or you want to see the date your script was run - do:
dd.add_output_folder(with_date=True)
or:
dd.add_output_folder(True)
There is way to choose folder name using a file:
dd.add_output_folder(pyfile="python-file.py") # will create a folder python-file_log
or:
dd.add_output_folder(folder="my-cool-folder") # will create a folder my-cool-folder
You can config snoop with:
dd.snoopconfig(snoop-config-options).
All options but builtins and snoop names are valid.
config icecream.includeContext (dd() calls filename, line number, and parent function to dd output.) by:dd.icecream_includeContext = True.
config friendly.language by dd.friendly_lang = "<languages>"
config rich color-system by: dd.rich_color_system = <color-system>
with dd equal to with snoop.
dd.inspect(obj) equal to rich.inspect
dd.pprint wiil pretty print the variable using rich
dd.deep equal to snoop.pp.deep
ddebug depends on the python librarys:
dd.watch and dd.unwatchdd.diffOn all errors, problems or suggestions please open a github issue
If you found this library useful, it would be great if you could buy me a coffee:
FAQs
python library with a set of tools for simple debugging of python programs
We found that ddebug demonstrated a healthy version release cadence and project activity because the last version was released less than a year ago. It has 1 open source maintainer collaborating on the project.
Did you know?

Socket for GitHub automatically highlights issues in each pull request and monitors the health of all your open source dependencies. Discover the contents of your packages and block harmful activity before you install or update your dependencies.

Product
Socket’s new Tier 1 Reachability filters out up to 80% of irrelevant CVEs, so security teams can focus on the vulnerabilities that matter.

Research
/Security News
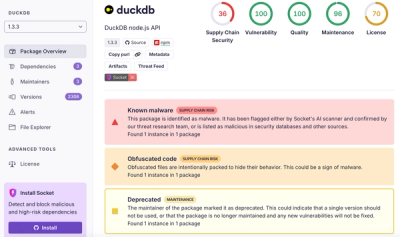
Ongoing npm supply chain attack spreads to DuckDB: multiple packages compromised with the same wallet-drainer malware.

Security News
The MCP Steering Committee has launched the official MCP Registry in preview, a central hub for discovering and publishing MCP servers.