MassComposition


MassComposition is a python package that allows Geoscientists and Metallurgists to easily work with, and visualise
mass-compositional data.
Mass Composition in this context is just that - Mass and Composition. It is not Compositional Data Analysis (CoDA),
since here we care more about mathematical operations like weight averaging and technically correct mathematical
operations. Of course, we also need to manage moisture correctly - chemical composition is reported on a dry basis
and moisture on a wet basis.
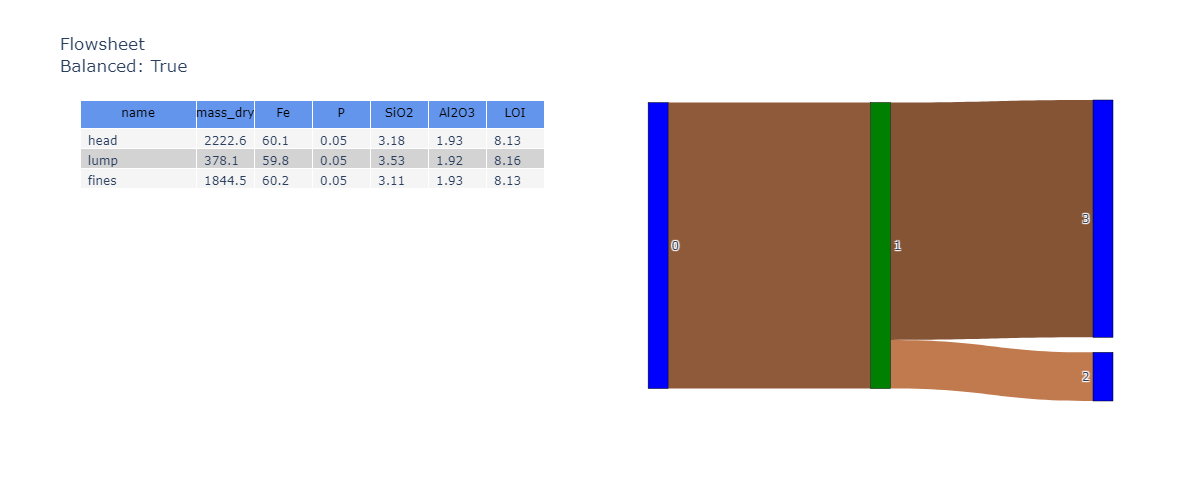
The package not only supports individual MassComposition, but collections of objects that are
mathematically related in a Directional Graph (a.k.a. network or flowsheet).
Prerequisites
Before you begin, ensure you have met the following requirements:
- You have installed the latest version of the mass-composition python package.
- You have a Windows/Linux/Mac machine.
- You have read the docs.
Installing MassComposition
To install MassComposition, follow these steps:
pip install mass-composition -e .[viz,network]
Or, if poetry is more your flavour.
poetry add "mass-composition[viz,network]"
Using MassComposition
To use MassComposition, follow these steps:
There are some basic requirements that the incoming DataFrame must meet. We'll use a sample DataFrame here.
df_data: pd.DataFrame = sample_data()
Create the object
obj_mc: MassComposition = MassComposition(df_data)
It is then trivial to calculate the weight average aggregate of the dataset.
obj_mc.aggregate()
Multiple composition analytes can be viewed in a single interactive parallel coordinates plot.
obj_mc: MassComposition = MassComposition(df_data.reset_index().set_index(['DHID', 'interval_from', 'interval_to']),
                                          name=name)

fig: Figure = obj_mc.plot_parallel(color='Fe')
fig
Network visualisations and other plots are interactive.
For full examples, see the gallery.
Contributing to MassComposition
To contribute to MassComposition, follow these steps:
- Fork this repository.
- Create a branch:
git checkout -b <branch_name>.
- Make your changes and commit them:
git commit -m '<commit_message>'
- Push to the original branch:
git push origin mass-composition
- Create the pull request.
Alternatively see the GitHub documentation on creating a pull request.
Contributors
This project is still in its infancy, but I'm keen to work with contributors.
Contact
If you want to contact me you can reach me at your_email@address.com.
License
This project uses the following license: MIT.