Security News
Research
Data Theft Repackaged: A Case Study in Malicious Wrapper Packages on npm
The Socket Research Team breaks down a malicious wrapper package that uses obfuscation to harvest credentials and exfiltrate sensitive data.
newrelic-telemetry-sdk
Advanced tools
|header|
.. |header| image:: https://github.com/newrelic/open-source-office/raw/master/examples/categories/images/Community_Project.png :target: https://github.com/newrelic/open-source-office/blob/master/examples/categories/index.md#category-community-project
|ci| |coverage| |docs| |black|
.. |ci| image:: https://github.com/newrelic/newrelic-telemetry-sdk-python/workflows/Tests/badge.svg :target: https://github.com/newrelic/newrelic-telemetry-sdk-python/actions?query=workflow%3ATests
.. |coverage| image:: https://img.shields.io/codecov/c/github/newrelic/newrelic-telemetry-sdk-python/main :target: https://codecov.io/gh/newrelic/newrelic-telemetry-sdk-python
.. |docs| image:: https://img.shields.io/badge/docs-available-brightgreen.svg :target: https://newrelic.github.io/newrelic-telemetry-sdk-python/
.. |black| image:: https://img.shields.io/badge/code%20style-black-000000.svg :target: https://github.com/psf/black
newrelic-telemetry-sdk-python <https://docs.newrelic.com/docs/data-ingest-apis/get-data-new-relic/new-relic-sdks/telemetry-sdks-send-custom-telemetry-data-new-relic>_ provides a Python library for sending data into New Relic <https://newrelic.com>_ using the Python urllib3 <https://urllib3.readthedocs.io>_ library.
See dimensional metrics, events, logs, and spans/traces in New Relic, without having to use an agent!
.. _metrics: https://docs.newrelic.com/docs/data-ingest-apis/get-data-new-relic/metric-api/introduction-metric-api#find-data .. _events: https://docs.newrelic.com/docs/insights/insights-data-sources/custom-data/introduction-event-api#find-data .. _logs: https://docs.newrelic.com/docs/logs/log-management/ui-data/explore-your-data-log-analytics .. _spans/traces: https://docs.newrelic.com/docs/understand-dependencies/distributed-tracing/trace-api/introduction-trace-api#view-data
To start, the newrelic-telemetry-sdk package must be installed. To install
through pip:
.. code-block:: bash
$ pip install newrelic-telemetry-sdk
If that fails, download the library from its GitHub page and install it using:
.. code-block:: bash
$ python setup.py install
There are 3 different types of metrics:
Metric descriptions ^^^^^^^^^^^^^^^^^^^
+-------------+----------+----------------------------------------------------+-----------------------------------------------+ | Metric type | Interval | Description | Example | | | required | | | +=============+==========+====================================================+===============================================+ | Gauge | No | A single value at a single point in time. | Room Temperature. | +-------------+----------+----------------------------------------------------+-----------------------------------------------+ | Count | Yes | Track the total number of occurrences of an event. | Number of errors that have occurred. | +-------------+----------+----------------------------------------------------+-----------------------------------------------+ | Summary | Yes | Track count, sum, min, and max values over time. | The summarized duration of 100 HTTP requests. | +-------------+----------+----------------------------------------------------+-----------------------------------------------+
Example ^^^^^^^ The example code assumes you've set the following environment variables:
NEW_RELIC_LICENSE_KEY.. code-block:: python
import os
import time
from newrelic_telemetry_sdk import GaugeMetric, CountMetric, SummaryMetric, MetricClient

metric_client = MetricClient(os.environ["NEW_RELIC_LICENSE_KEY"])

temperature = GaugeMetric("temperature", 78.6, {"units": "Farenheit"})

# Record that there have been 5 errors in the last 2 seconds
errors = CountMetric(name="errors", value=5, interval_ms=2000)

# Record a summary of 10 response times over the last 2 seconds
summary = SummaryMetric(
    "responses", count=10, min=0.2, max=0.5, sum=4.7, interval_ms=2000
)

batch = [temperature, errors, summary]
response = metric_client.send_batch(batch)
response.raise_for_status()
print("Sent metrics successfully!")
Events represent a record of something that has occurred on a system being monitored. The example code assumes you've set the following environment variables:
NEW_RELIC_LICENSE_KEY.. code-block:: python
import os
import time
from newrelic_telemetry_sdk import Event, EventClient

# Record that a rate limit has been applied to an endpoint for an account
event = Event(
    "RateLimit", {"path": "/v1/endpoint", "accountId": 1000, "rejectRatio": 0.1}
)

event_client = EventClient(os.environ["NEW_RELIC_LICENSE_KEY"])
response = event_client.send(event)
response.raise_for_status()
print("Event sent successfully!")
Log messages are generated by applications, usually via the Python logging module. These messages are used to audit and diagnose issues with an operating application. The example code assumes you've set the following environment variables:
NEW_RELIC_LICENSE_KEY.. code-block:: python
import os

from newrelic_telemetry_sdk import Log, LogClient

log = Log("Hello World!")

log_client = LogClient(os.environ["NEW_RELIC_LICENSE_KEY"])
response = log_client.send(log)
response.raise_for_status()
print("Log sent successfully!")
Spans provide an easy way to time components of your code. The example code assumes you've set the following environment variables:
NEW_RELIC_LICENSE_KEY.. code-block:: python
import os
import time
from newrelic_telemetry_sdk import Span, SpanClient

with Span(name="sleep") as span:
    time.sleep(0.5)

span_client = SpanClient(os.environ["NEW_RELIC_LICENSE_KEY"])
response = span_client.send(span)
response.raise_for_status()
print("Span sleep sent successfully!")
Tips on how to find and query your data in New Relic:
Find metric data <https://docs.newrelic.com/docs/data-ingest-apis/get-data-new-relic/metric-api/introduction-metric-api#find-data>_Find event data <https://docs.newrelic.com/docs/insights/insights-data-sources/custom-data/introduction-event-api#find-data>_Find log data <https://docs.newrelic.com/docs/logs/log-management/ui-data/explore-your-data-log-analytics>_Find trace/span data <https://docs.newrelic.com/docs/understand-dependencies/distributed-tracing/trace-api/introduction-trace-api#view-data>_For general querying information, see:
Query New Relic data <https://docs.newrelic.com/docs/using-new-relic/data/understand-data/query-new-relic-data>_Intro to NRQL <https://docs.newrelic.com/docs/query-data/nrql-new-relic-query-language/getting-started/introduction-nrql>_The New Relic Telemetry APIs are rate limited. Please reference the documentation for New Relic Metrics API <https://docs.newrelic.com/docs/introduction-new-relic-metric-api>_ and New Relic Trace API requirements and limits <https://docs.newrelic.com/docs/apm/distributed-tracing/trace-api/trace-api-general-requirements-limits>_ on the specifics of the rate limits.
FAQs
New Relic Telemetry SDK
We found that newrelic-telemetry-sdk demonstrated a healthy version release cadence and project activity because the last version was released less than a year ago. It has 1 open source maintainer collaborating on the project.
Did you know?

Socket for GitHub automatically highlights issues in each pull request and monitors the health of all your open source dependencies. Discover the contents of your packages and block harmful activity before you install or update your dependencies.

Security News
Research
The Socket Research Team breaks down a malicious wrapper package that uses obfuscation to harvest credentials and exfiltrate sensitive data.

Research
Security News
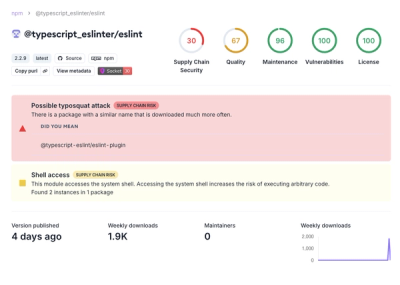
Attackers used a malicious npm package typosquatting a popular ESLint plugin to steal sensitive data, execute commands, and exploit developer systems.

Security News
The Ultralytics' PyPI Package was compromised four times in one weekend through GitHub Actions cache poisoning and failure to rotate previously compromised API tokens.