Research
Security News
Malicious npm Package Targets Solana Developers and Hijacks Funds
A malicious npm package targets Solana developers, rerouting funds in 2% of transactions to a hardcoded address.
Scalene: A high-resolution, low-overhead CPU, GPU, and memory profiler for Python with AI-powered optimization suggestions
![]()
by Emery Berger, Sam Stern, and Juan Altmayer Pizzorno.

(tweet from Ian Ozsvald, author of High Performance Python)

Scalene web-based user interface: http://plasma-umass.org/scalene-gui/
Scalene is a high-performance CPU, GPU and memory profiler for Python that does a number of things that other Python profilers do not and cannot do. It runs orders of magnitude faster than many other profilers while delivering far more detailed information. It is also the first profiler ever to incorporate AI-powered proposed optimizations.
Note
To enable AI-powered optimization suggestions, you need to enter an OpenAI key in the box under "Advanced options". Your account will need to have a positive balance for this to work (check your balance at https://platform.openai.com/account/usage).

Once you've entered your OpenAI key (see above), click on the lightning bolt (⚡) beside any line or the explosion (💥) for an entire region of code to generate a proposed optimization. Click on a proposed optimization to copy it to the clipboard.

You can click as many times as you like on the lightning bolt or explosion, and it will generate different suggested optimizations. Your mileage may vary, but in some cases, the suggestions are quite impressive (e.g., order-of-magnitude improvements).
python3 -m pip install -U scalene
or
conda install -c conda-forge scalene
After installing Scalene, you can use Scalene at the command line, or as a Visual Studio Code extension.
First, install the Scalene extension from the VS Code Marketplace or by searching for it within VS Code by typing Command-Shift-X (Mac) or Ctrl-Shift-X (Windows). Once that's installed, click Command-Shift-P or Ctrl-Shift-P to open the Command Palette. Then select "Scalene: AI-powered profiling..." (you can start typing Scalene and it will pop up if it's installed). Run that and, assuming your code runs for at least a second, a Scalene profile will appear in a webview.
scalene your_prog.py                             # full profile (outputs to web interface)
python3 -m scalene your_prog.py                  # equivalent alternative

scalene --cli your_prog.py                       # use the command-line only (no web interface)

scalene --cpu your_prog.py                       # only profile CPU
scalene --cpu --gpu your_prog.py                 # only profile CPU and GPU
scalene --cpu --gpu --memory your_prog.py        # profile everything (same as no options)

scalene --reduced-profile your_prog.py           # only profile lines with significant usage
scalene --profile-interval 5.0 your_prog.py      # output a new profile every five seconds

scalene (Scalene options) --- your_prog.py (...) # use --- to tell Scalene to ignore options after that point
scalene --help                                   # lists all options
Invoke using scalene as above and then:
from scalene import scalene_profiler

# Turn profiling on
scalene_profiler.start()

# your code

# Turn profiling off
scalene_profiler.stop()
from scalene.scalene_profiler import enable_profiling

with enable_profiling():
    # do something
@profile:
Just preface any functions you want to profile with the @profile decorator and run it with Scalene:
# do not import profile!

@profile
def slow_function():
    import time
    time.sleep(3)
Scalene has both a CLI and a web-based GUI (demo here).
By default, once Scalene has profiled your program, it will open a
tab in a web browser with an interactive user interface (all processing is done
locally). Hover over bars to see breakdowns of CPU and memory
consumption, and click on underlined column headers to sort the
columns. The generated file profile.html is self-contained and can be saved for later use.
This talk presented at PyCon 2021 walks through Scalene's advantages and how to use it to debug the performance of an application (and provides some technical details on its internals). We highly recommend watching this video!
Scalene is fast. It uses sampling instead of instrumentation or relying on Python's tracing facilities. Its overhead is typically no more than 10-20% (and often less).
Scalene is accurate. We tested CPU profiler accuracy and found that Scalene is among the most accurate profilers, correctly measuring time taken.

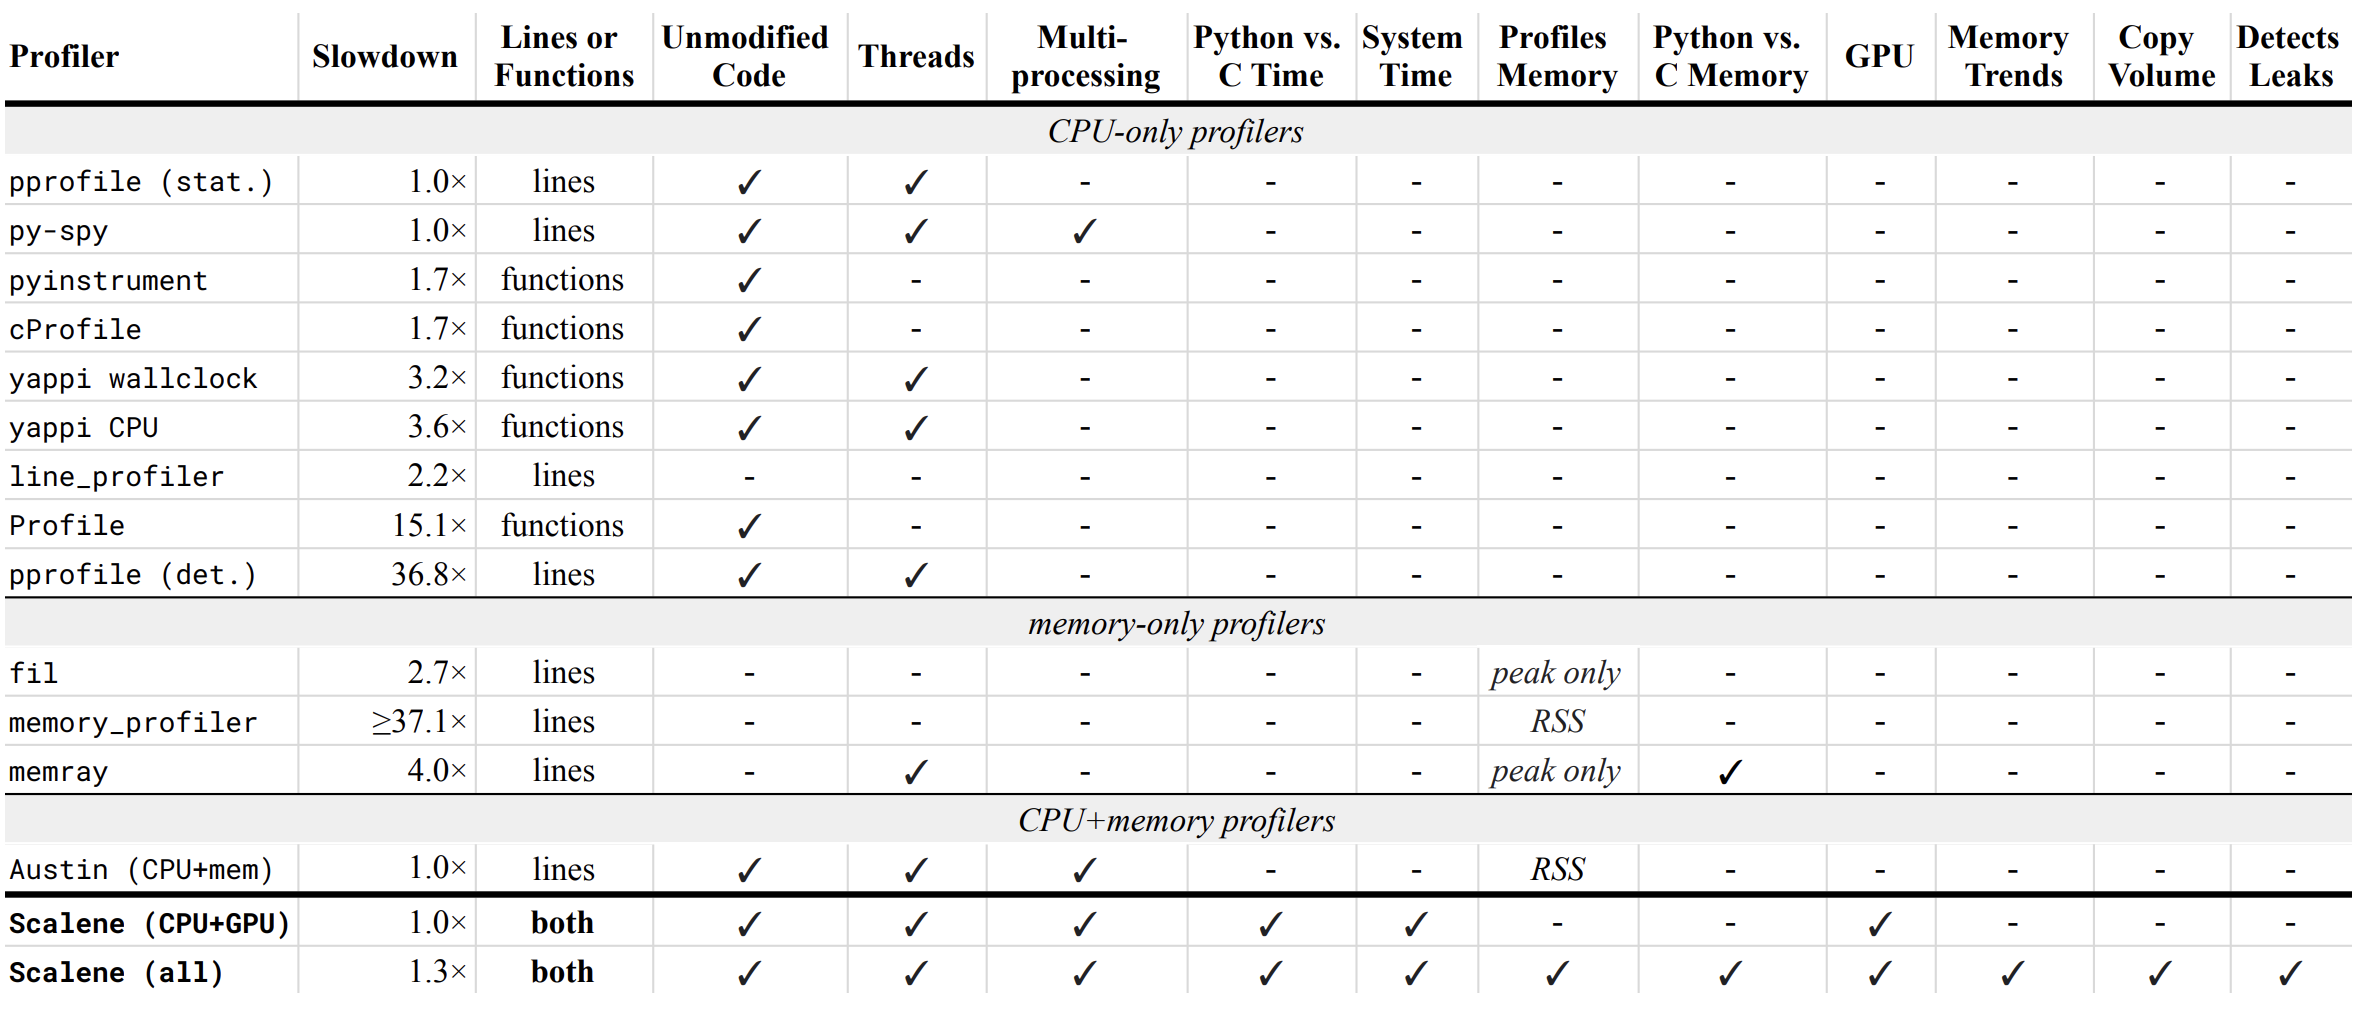
numpy arrays into Python arrays, and vice versa).--reduced-profile) that only report lines that consume more than 1% of CPU or perform at least 100 allocations.@profile decorators to profile only specific functions.&), you can suspend and resume profiling.Below is a table comparing the performance and features of various profilers to Scalene.

Scalene has all of the following features, many of which only Scalene supports:
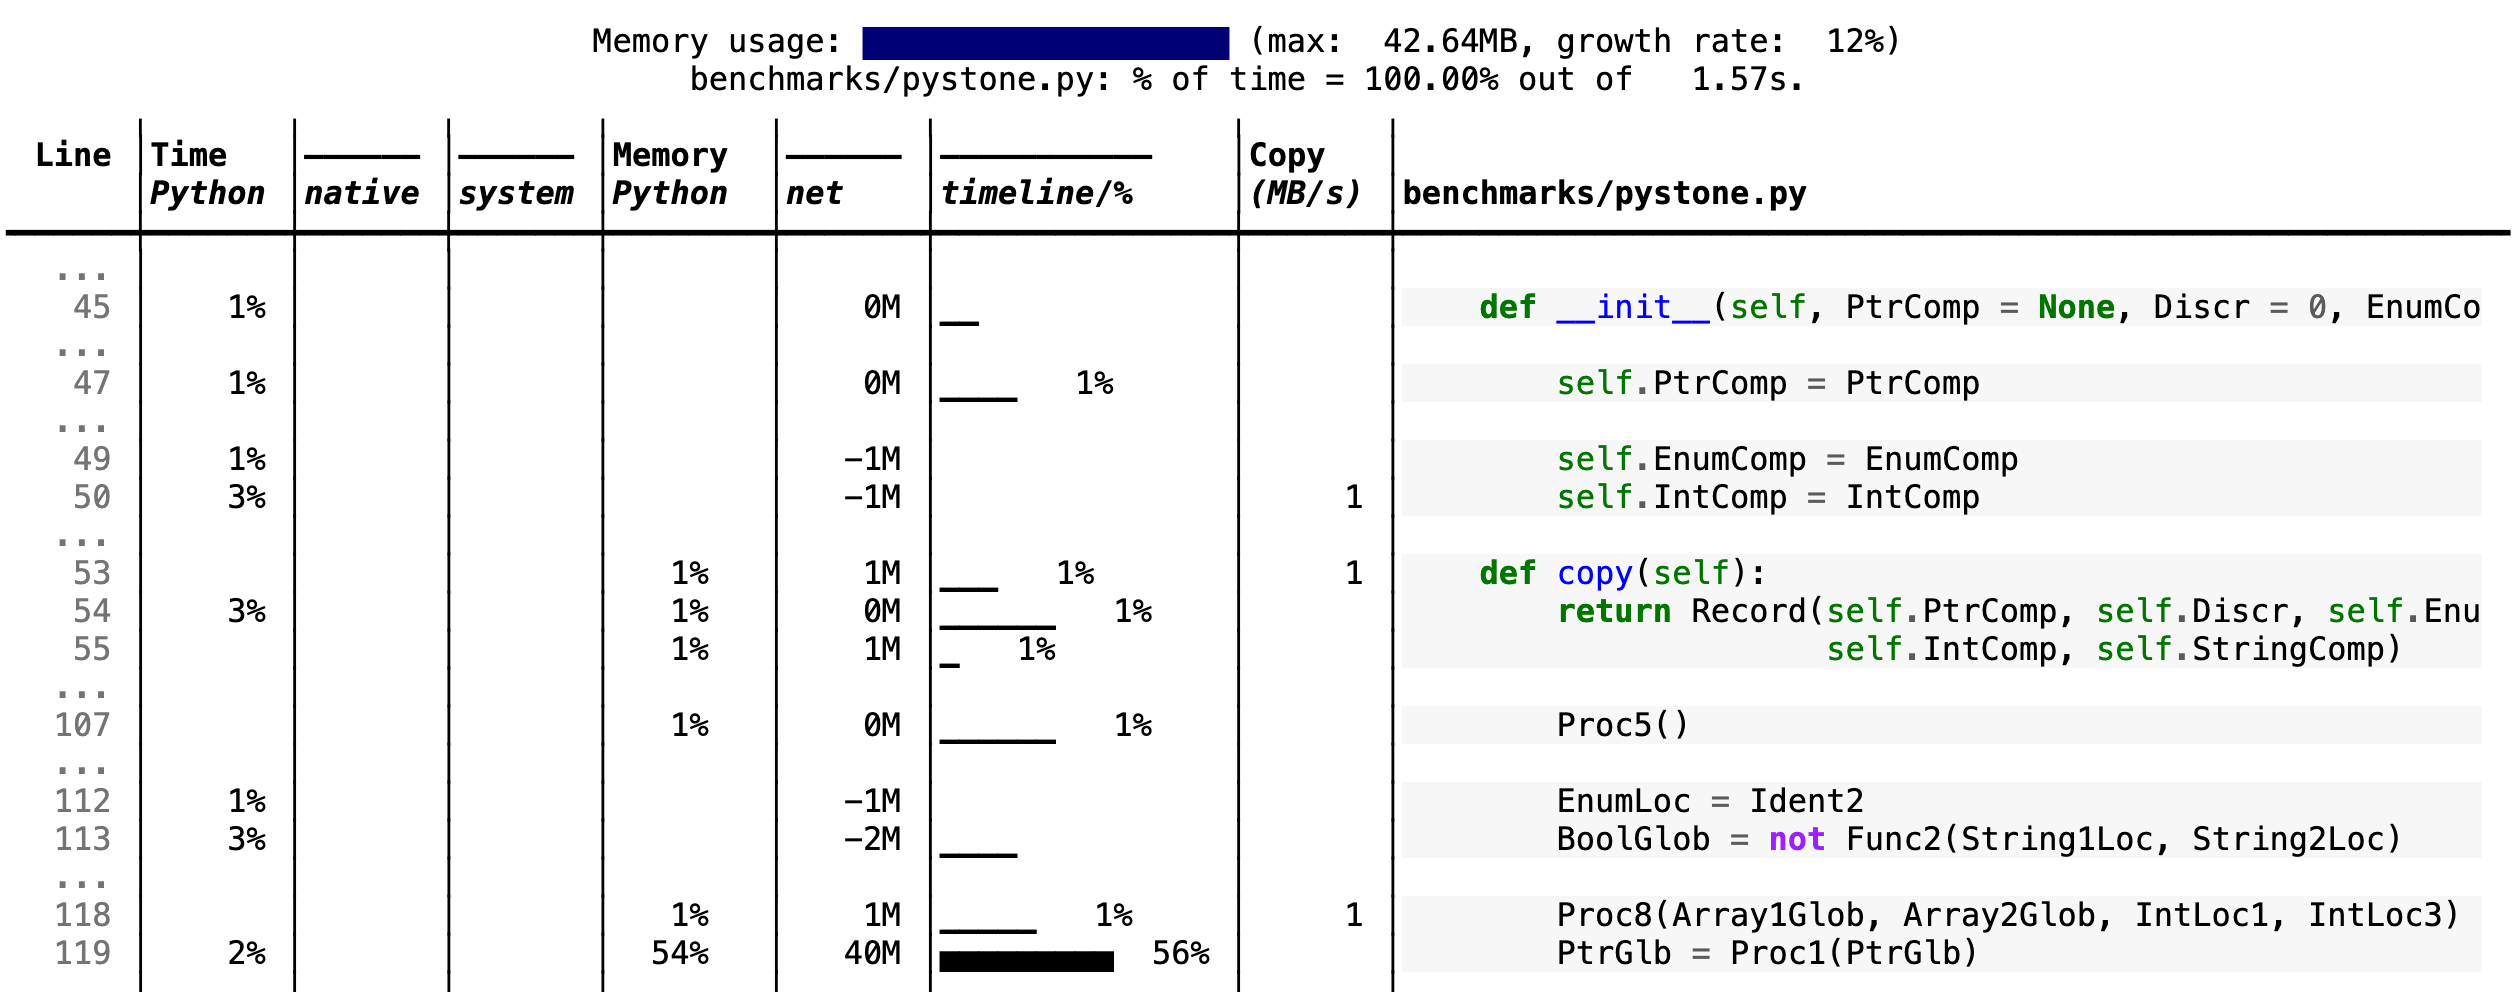
multiprocessing library -- Scalene onlyIf you include the --cli option, Scalene prints annotated source code for the program being profiled
(as text, JSON (--json), or HTML (--html)) and any modules it
uses in the same directory or subdirectories (you can optionally have
it --profile-all and only include files with at least a
--cpu-percent-threshold of time). Here is a snippet from
pystone.py.

The following command runs Scalene on a provided example program.
scalene test/testme.py
--help)
    % scalene --help
     usage: scalene [-h] [--outfile OUTFILE] [--html] [--reduced-profile]
                    [--profile-interval PROFILE_INTERVAL] [--cpu-only]
                    [--profile-all] [--profile-only PROFILE_ONLY]
                    [--use-virtual-time]
                    [--cpu-percent-threshold CPU_PERCENT_THRESHOLD]
                    [--cpu-sampling-rate CPU_SAMPLING_RATE]
                    [--malloc-threshold MALLOC_THRESHOLD]

     Scalene: a high-precision CPU and memory profiler.
     https://github.com/plasma-umass/scalene

     command-line:
        % scalene [options] yourprogram.py
     or
        % python3 -m scalene [options] yourprogram.py

     in Jupyter, line mode:
        %scrun [options] statement

     in Jupyter, cell mode:
        %%scalene [options]
        code...
        code...

     optional arguments:
       -h, --help            show this help message and exit
       --outfile OUTFILE     file to hold profiler output (default: stdout)
       --html                output as HTML (default: text)
       --reduced-profile     generate a reduced profile, with non-zero lines only (default: False)
       --profile-interval PROFILE_INTERVAL
                             output profiles every so many seconds (default: inf)
       --cpu-only            only profile CPU time (default: profile CPU, memory, and copying)
       --profile-all         profile all executed code, not just the target program (default: only the target program)
       --profile-only PROFILE_ONLY
                             profile only code in filenames that contain the given strings, separated by commas (default: no restrictions)
       --use-virtual-time    measure only CPU time, not time spent in I/O or blocking (default: False)
       --cpu-percent-threshold CPU_PERCENT_THRESHOLD
                             only report profiles with at least this percent of CPU time (default: 1%)
       --cpu-sampling-rate CPU_SAMPLING_RATE
                             CPU sampling rate (default: every 0.01s)
       --malloc-threshold MALLOC_THRESHOLD
                             only report profiles with at least this many allocations (default: 100)

     When running Scalene in the background, you can suspend/resume profiling
     for the process ID that Scalene reports. For example:

        % python3 -m scalene [options] yourprogram.py &
      Scalene now profiling process 12345
        to suspend profiling: python3 -m scalene.profile --off --pid 12345
        to resume profiling:  python3 -m scalene.profile --on  --pid 12345
This notebook illustrates the use of Scalene in Jupyter.
Installation:
!pip install scalene

%load_ext scalene
Line mode:
%scrun [options] statement
Cell mode:
%%scalene [options]
code...
code...
pip (Mac OS X, Linux, Windows, and WSL2)Scalene is distributed as a pip package and works on Mac OS X, Linux (including Ubuntu in Windows WSL2) and (with limitations) Windows platforms.
Note
The Windows version currently only supports CPU and GPU profiling, but not memory or copy profiling.
You can install it as follows:
% pip install -U scalene
or
% python3 -m pip install -U scalene
You may need to install some packages first.
See https://stackoverflow.com/a/19344978/4954434 for full instructions for all Linux flavors.
For Ubuntu/Debian:
% sudo apt install git python3-all-dev
conda (Mac OS X, Linux, Windows, and WSL2) % conda install -c conda-forge scalene
Scalene is distributed as a conda package and works on Mac OS X, Linux (including Ubuntu in Windows WSL2) and (with limitations) Windows platforms.
Note
The Windows version currently only supports CPU and GPU profiling, but not memory or copy profiling.
You can install Scalene on Arch Linux via the AUR
package. Use your favorite AUR helper, or
manually download the PKGBUILD and run makepkg -cirs to build. Note that this will place
libscalene.so in /usr/lib; modify the below usage instructions accordingly.
A: Yes! You can run it as follows (for example):
python3 -m scalene --- -m pytest your_test.py
A: Yes! There are several options:
--reduced-profile to include only lines and files with memory/CPU/GPU activity.--profile-only to include only filenames containing specific strings (as in, --profile-only foo,bar,baz).@profile to have Scalene report only those functions.from scalene import scalene_profiler) and then turning profiling on and off via scalene_profiler.start() and scalene_profiler.stop(). By default, Scalene runs with profiling on, so to delay profiling until desired, use the --off command-line option (python3 -m scalene --off yourprogram.py).A: In PyCharm, you can run Scalene at the command line by opening the terminal at the bottom of the IDE and running a Scalene command (e.g., python -m scalene <your program>). Use the options --cli, --html, and --outfile <your output.html> to generate an HTML file that you can then view in the IDE.
A: Pass in the --noreload option (see https://github.com/plasma-umass/scalene/issues/178).
A: Yes! Put the following code in the beginning of your program, or modify the call to monkey.patch_all as below:
from gevent import monkey
monkey.patch_all(thread=False)
A: Scalene works with PyTorch version 1.5.1 on Mac OS X. There's a bug in newer versions of PyTorch (https://github.com/pytorch/pytorch/issues/57185) that interferes with Scalene (discussion here: https://github.com/plasma-umass/scalene/issues/110), but only on Macs.
For details about how Scalene works, please see the following paper, which won the Jay Lepreau Best Paper Award at OSDI 2023: Triangulating Python Performance Issues with Scalene. (Note that this paper does not include information about the AI-driven proposed optimizations.)
@inproceedings{288540,
author = {Emery D. Berger and Sam Stern and Juan Altmayer Pizzorno},
title = {Triangulating Python Performance Issues with {S}calene},
booktitle = {{17th USENIX Symposium on Operating Systems Design and Implementation (OSDI 23)}},
year = {2023},
isbn = {978-1-939133-34-2},
address = {Boston, MA},
pages = {51--64},
url = {https://www.usenix.org/conference/osdi23/presentation/berger},
publisher = {USENIX Association},
month = jul
}
If you use Scalene to successfully debug a performance problem, please add a comment to this issue!
Logo created by Sophia Berger.
This material is based upon work supported by the National Science Foundation under Grant No. 1955610. Any opinions, findings, and conclusions or recommendations expressed in this material are those of the author(s) and do not necessarily reflect the views of the National Science Foundation.
FAQs
Scalene: A high-resolution, low-overhead CPU, GPU, and memory profiler for Python with AI-powered optimization suggestions
We found that scalene demonstrated a healthy version release cadence and project activity because the last version was released less than a year ago. It has 1 open source maintainer collaborating on the project.
Did you know?

Socket for GitHub automatically highlights issues in each pull request and monitors the health of all your open source dependencies. Discover the contents of your packages and block harmful activity before you install or update your dependencies.

Research
Security News
A malicious npm package targets Solana developers, rerouting funds in 2% of transactions to a hardcoded address.

Security News
Research
Socket researchers have discovered malicious npm packages targeting crypto developers, stealing credentials and wallet data using spyware delivered through typosquats of popular cryptographic libraries.

Security News
Socket's package search now displays weekly downloads for npm packages, helping developers quickly assess popularity and make more informed decisions.