Shot Chart
Python module to plot NBA shot chart data and distributions for players and teams and some utilities.
This file will become your README and also the index of your documentation.
Install
pip install shot_chart
How to use
We first create a pandas dataframe from the source data.
shots_2019 = make_df(untar_data(URLs.SHOTS_2019))
Listing teams for the season
list_teams(shots_2019)
0            Atlanta
1            Orlando
183       Sacramento
184             Utah
341         Oklahoma
343     Golden State
511           Denver
512      New Orleans
675        Milwaukee
1016        Portland
1224         Phoenix
1226        Brooklyn
1412     San Antonio
1413         Memphis
1934         Toronto
2119    Philadelphia
2296       Minnesota
2477       LA Lakers
2655         Houston
2656     LA Clippers
2843       Charlotte
3017          Boston
3018      Washington
3383         Detroit
3918           Miami
5020       Cleveland
5535         Indiana
6407        New York
6410         Chicago
8473          Dallas
Name: team, dtype: object
Listing players who took at least 1 shot for a particular team
list_team_players(shots_2019, 'Portland')
.dataframe tbody tr th:only-of-type {
vertical-align: middle;
}
.dataframe tbody tr th {
vertical-align: top;
}
.dataframe thead th {
text-align: right;
}
| shots_by | count |
|---|
| 2 | CJ McCollum | 1212 |
|---|
| 5 | Damian Lillard | 1158 |
|---|
| 4 | Carmelo Anthony | 678 |
|---|
| 7 | Hassan Whiteside | 676 |
|---|
| 0 | Anfernee Simons | 522 |
|---|
| 6 | Gary Trent | 349 |
|---|
| 9 | Kent Bazemore | 322 |
|---|
| 10 | Mario Hezonja | 188 |
|---|
| 13 | Rodney Hood | 172 |
|---|
| 15 | Trevor Ariza | 159 |
|---|
| 12 | Nassir Little | 151 |
|---|
| 14 | Skal Labissière | 147 |
|---|
| 1 | Anthony Tolliver | 117 |
|---|
| 3 | Caleb Swanigan | 43 |
|---|
| 8 | Jaylen Hoard | 32 |
|---|
| 16 | Wenyen Gabriel | 29 |
|---|
| 17 | Zach Collins | 19 |
|---|
| 11 | Moses Brown | 10 |
|---|
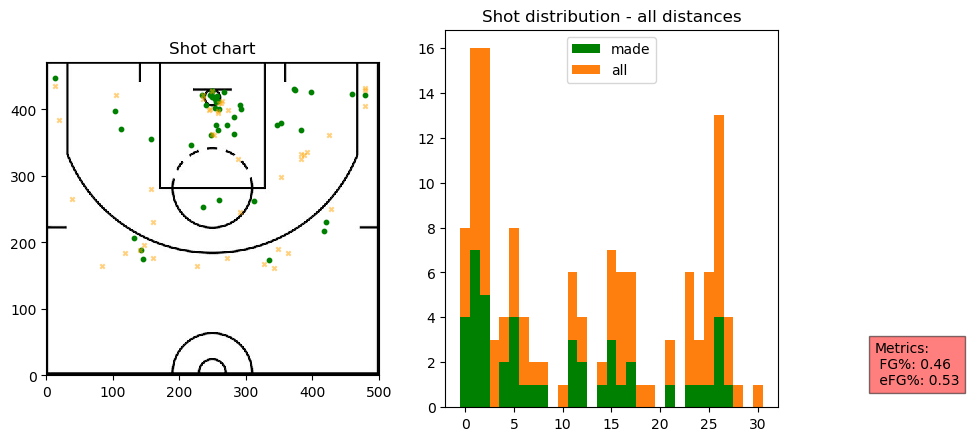
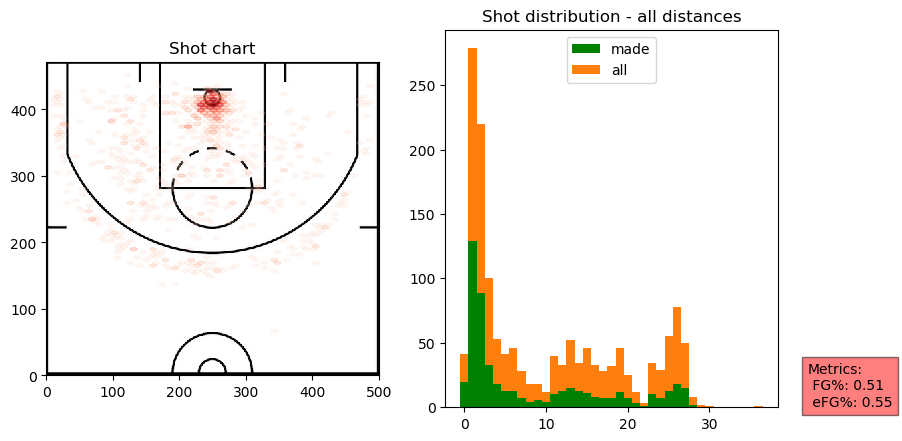
Plotting team shot distribution
houston = TeamShots(shots_2019,"Houston")
houston.plot_shots()
houston.plot_shots(date_range=((2020,1,3), (2020,1,11)))
Please check the extra options when using the plotting functions
portland_20191125 = TeamShots(shots_2019,"Portland")
portland_20191125.list_game_ids(2019,11,25)
.dataframe tbody tr th:only-of-type {
vertical-align: middle;
}
.dataframe tbody tr th {
vertical-align: top;
}
.dataframe thead th {
text-align: right;
}
| game_id | winner | loser |
|---|
| 45560 | 201911250CHI | Portland | Chicago |
|---|
portland_20191125.plot_shots("201911250CHI")
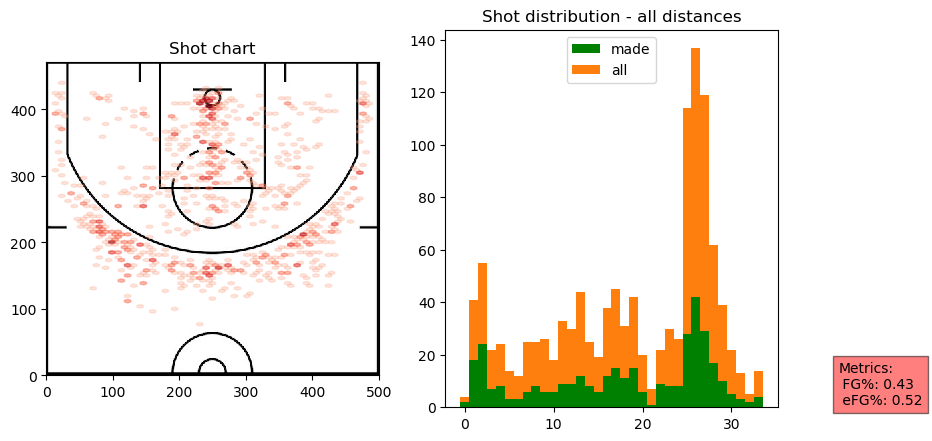
Plotting player shot distribution
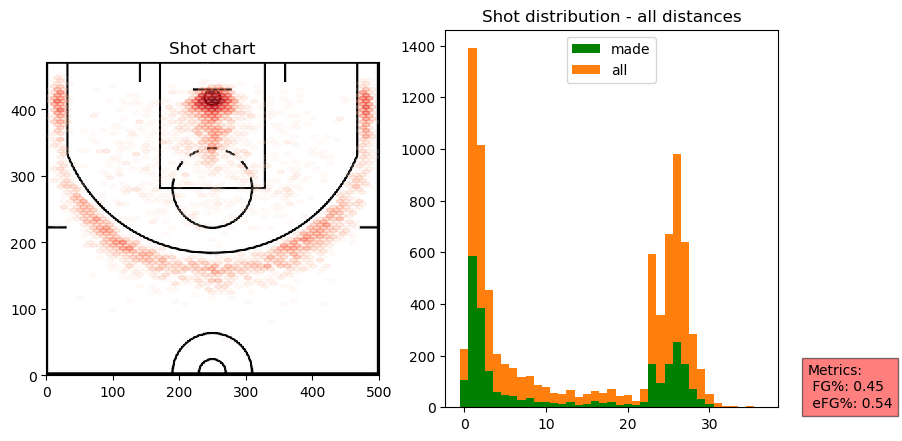
player_shots = PlayerShots(shots_2019,"Anthony Davis")
player_shots.plot_shots()
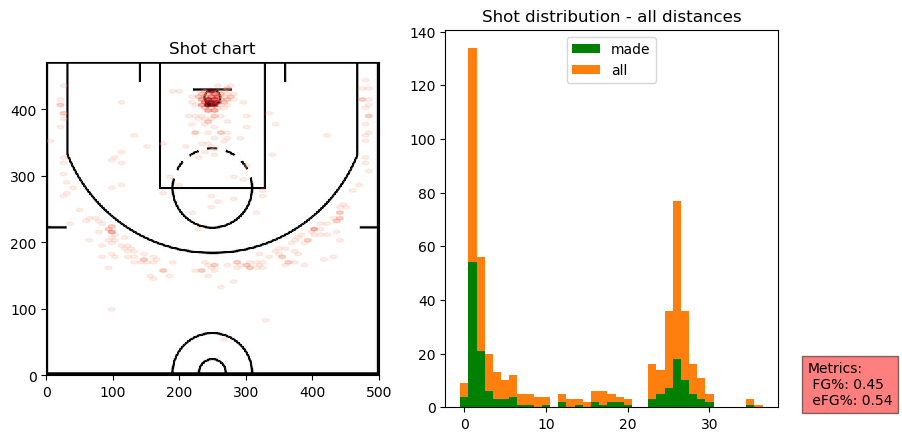
dlo = PlayerShots(shots_2019,"D'Angelo Russell")
dlo.plot_shots()
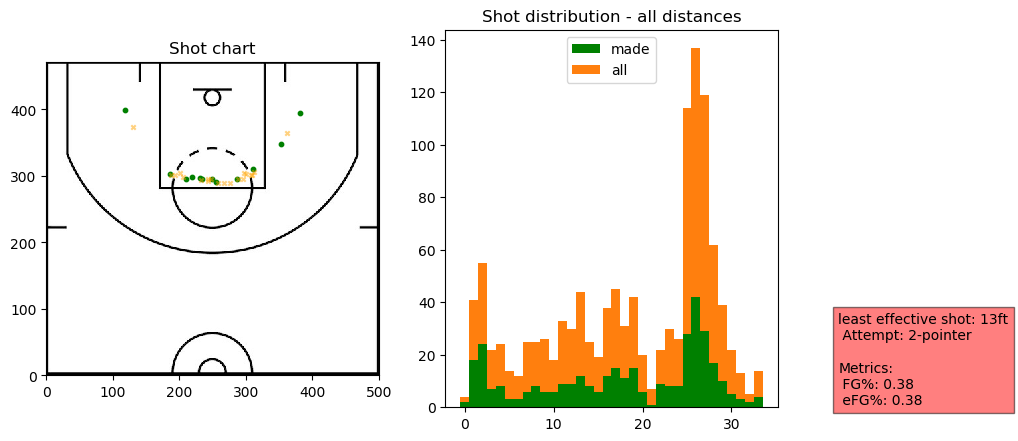
dlo.plot_shots(distance_limit=(16,26),attempt="2-pointer")
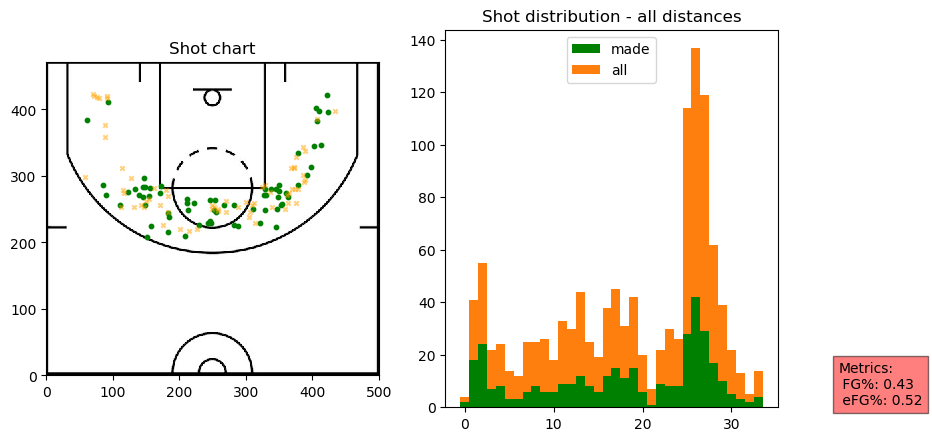
dlo.plot_effective(most_or_least="most")

dlo.plot_effective(most_or_least="most",exclude=["0ft"])

dlo.plot_effective(most_or_least="most",min_shots="auto",exclude=['2ft'])

dlo.plot_effective(most_or_least="least")

dlo.plot_effective(most_or_least="least",min_shots="auto")