SQLAlchemy Easy Profile


Inspired by django-querycount,
is a library that hooks into SQLAlchemy to collect metrics, streaming statistics into
console output and help you understand where in application you have slow or redundant
queries.
Installation
Install the package with pip:
pip install sqlalchemy-easy-profile
Session profiler
The profiling session hooks into SQLAlchemy and captures query statements, duration information,
and query parameters. You also may have multiple profiling sessions active at the same
time on the same or different Engines. If multiple profiling sessions are active on the
same engine, queries on that engine will be collected by both sessions and reported on
different reporters.
You may begin and commit a profiling session as much as you like. Calling begin on an already
started session or commit on an already committed session will raise an AssertionError.
You also can use a contextmanager interface for session profiling or used it like a decorator.
This has the effect of only profiling queries occurred within the decorated function or inside
a manager context.
How to use begin and commit:
from easy_profile import SessionProfiler

profiler = SessionProfiler()

profiler.begin()
session.query(User).filter(User.name == "Arthur Dent").first()
profiler.commit()

print(profiler.stats)
How to use as a context manager interface:
profiler = SessionProfiler()
with profiler:
    session.query(User).filter(User.name == "Arthur Dent").first()

print(profiler.stats)
How to use profiler as a decorator:
profiler = SessionProfiler()

class UsersResource:
    @profiler()
    def on_get(self, req, resp, **args, **kwargs):
        return session.query(User).all()
Keep in mind that profiler decorator interface accepts a special reporter and
If it was not defined by default will be used a base streaming reporter. Decorator
also accept name and name_callback optional parameters.
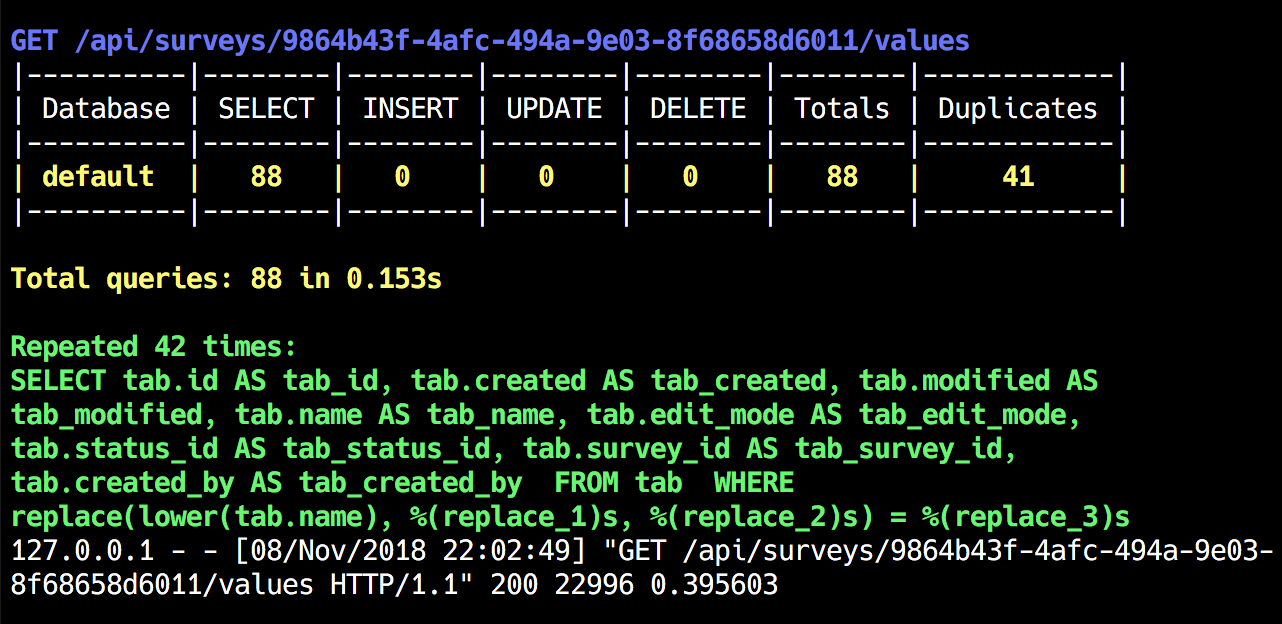
WSGI integration
Easy Profiler provides a specified middleware which can prints the number of database
queries for each HTTP request and can be applied as a WSGI server middleware. So you
can easily integrate Easy Profiler into any WSGI application.
How to integrate with a Flask application:
from flask import Flask
from easy_profile import EasyProfileMiddleware

app = Flask(__name__)
app.wsgi_app = EasyProfileMiddleware(app.wsgi_app)
How to integrate with a Falcon application:
import falcon
from easy_profile import EasyProfileMiddleware

api = application = falcon.API()
application = EasyProfileMiddleware(application)
How to customize output
The StreamReporter accepts medium-high thresholds, output file destination (stdout by default), a special
flag for disabling color formatting and number of displayed duplicated queries:
from flask import Flask
from easy_profile import EasyProfileMiddleware, StreamReporter

app = Flask(__name__)
app.wsgi_app = EasyProfileMiddleware(app.wsgi_app, reporter=StreamReporter(display_duplicates=100))
Any custom reporter can be created as:
from easy_profile.reporters import Reporter

class CustomReporter(Reporter):

    def report(self, path, stats):
        """Do something with path and stats.

        :param str path: where profiling occurred
        :param dict stats: profiling statistics

        """
        ...
Testing
To run the tests:
python setup.py test
Or use tox for running in all tests environments.
License
This code is distributed under the terms of the MIT license.
Changes
A full changelog is maintained in the CHANGELOG file.
Contributing
sqlalchemy-easy-profile is an open source project and contributions are
welcome! Check out the Issues
page to see if your idea for a contribution has already been mentioned, and feel
free to raise an issue or submit a pull request.


