Research
Security News
Malicious npm Package Targets Solana Developers and Hijacks Funds
A malicious npm package targets Solana developers, rerouting funds in 2% of transactions to a hardcoded address.
Rails wrapper to build charts using FusionCharts. http://www.fusioncharts.com
Add this line to your application's Gemfile:
gem 'fusioncharts-rails'
And then execute:
$ bundle
Or install it yourself as:
$ gem install fusioncharts-rails
You will have to download the latest fusioncharts library at http://www.fusioncharts.com/download/. Once you have downloaded and extracted, copy the javascript files into vendor/assets/javascripts/fusioncharts/.
Require the following lines in the app/assets/javascripts/application.js
//= require fusioncharts/fusioncharts
//= require fusioncharts/fusioncharts.charts
//= require fusioncharts/themes/fusioncharts.theme.fint
Create the FusionCharts object in the controller action like the following:
#Filename: app/controllers/dashboard_controller.rb

class DashboardController < ApplicationController

  def index

    @chart = Fusioncharts::Chart.new({
        width: "600",
        height: "400",
        type: "mscolumn2d",
        renderAt: "chartContainer",
        dataSource: {
            chart: {
            caption: "Comparison of Quarterly Revenue",
            subCaption: "Harry's SuperMart",
            xAxisname: "Quarter",
            yAxisName: "Amount ($)",
            numberPrefix: "$",
            theme: "fint",
            exportEnabled: "1",
            },
            categories: [{
                    category: [
                        { label: "Q1" },
                        { label: "Q2" },
                        { label: "Q3" },
                        { label: "Q4" }
                    ]
                }],
                dataset: [
                    {
                        seriesname: "Previous Year",
                        data: [
                            { value: "10000" },
                            { value: "11500" },
                            { value: "12500" },
                            { value: "15000" }
                        ]
                    },
                    {
                        seriesname: "Current Year",
                        data: [
                            { value: "25400" },
                            { value: "29800" },
                            { value: "21800" },
                            { value: "26800" }
                        ]
                    }
              ]
        }
    })

  end

end
In order to render the chart, you can use the render method in the specific view
<!-- Filename: app/views/dashboard/index.html.erb -->

<h3>My Chart</h3>
<div id="chartContainer"><%= @chart.render() %></div>
dataSource key (which can be set using the dataSource method or passed in as a hash in the chart constructor) can accept data which is in one of the following formats:
@chart.width = 600
@chart.height = 400
@chart.type = "column2d"
@chart.dataFormat = "json"
@chart.dataSource = {
    chart: {
            caption: "Comparison of Quarterly Revenue",
            subCaption: "Harry's SuperMart",
            xAxisname: "Quarter",
            yAxisName: "Amount ($)",
            numberPrefix: "$",
            theme: "fint",
            exportEnabled: "1",
            },
            categories: [{
                  category: [
                      { label: "Q1" },
                      { label: "Q2" },
                      { label: "Q3" },
                      { label: "Q4" }
                  ]
                }],
            dataset: [
                {
                    seriesname: "Previous Year",
                    data: [
                        { value: "10000" },
                        { value: "11500" },
                        { value: "12500" },
                        { value: "15000" }
                    ]
                },
                {
                    seriesname: "Current Year",
                    data: [
                        { value: "25400" },
                        { value: "29800" },
                        { value: "21800" },
                        { value: "26800" }
                    ]
                }
          ]
}
json data.@chart.jsonUrl = "/data/chart.json"
xml data.@chart.xmlUrl = "/data/chart.xml"
@chart.renderAt = "chartContainer"
@chart.render()
FAQs
Unknown package
We found that fusioncharts-rails demonstrated a not healthy version release cadence and project activity because the last version was released a year ago. It has 1 open source maintainer collaborating on the project.
Did you know?

Socket for GitHub automatically highlights issues in each pull request and monitors the health of all your open source dependencies. Discover the contents of your packages and block harmful activity before you install or update your dependencies.

Research
Security News
A malicious npm package targets Solana developers, rerouting funds in 2% of transactions to a hardcoded address.

Security News
Research
Socket researchers have discovered malicious npm packages targeting crypto developers, stealing credentials and wallet data using spyware delivered through typosquats of popular cryptographic libraries.

Security News
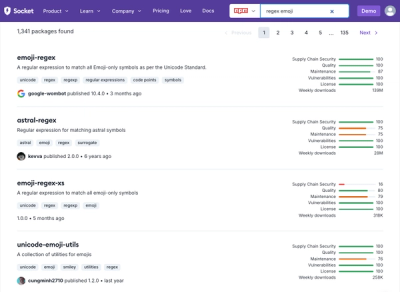
Socket's package search now displays weekly downloads for npm packages, helping developers quickly assess popularity and make more informed decisions.