Security News
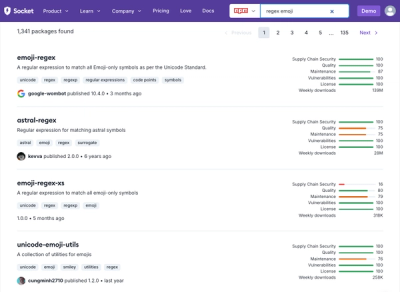
Weekly Downloads Now Available in npm Package Search Results
Socket's package search now displays weekly downloads for npm packages, helping developers quickly assess popularity and make more informed decisions.
github.com/jpmorganchase/quorum-profiling/tps-monitor
This is a tool to monitor transactions per second, total transactions and total blocks in Quorum. The tool can be used to calculate TPS in one of the following two ways given below:
In both modes it exposes the TPS data (aggregated per second) via http endpoint.
tpsmonitor has the capability to push the metrics data to a influxdb. It also has the capability to expose a prometheus end point from where the data can be pulled. Please refer to Usage for further details on this
Refer to scenario 3 here for all prerequisites.
Building tpsmonitor requires Go (version 1.13 or later). You can install it using your favourite package manager. Once the dependencies are installed, run
makefrom dirquorum-profiling/tps-monitor
tpsmonitorRun tpsmonitor --help to see usage.
| CLI Argument | Description |
|---|---|
| --consensus | Name of consensus ("raft" of "ibft") |
| --debug | Debug mode. Prints more verbose messages |
| --port | Port for tps monitor (default: 7575). It enables httpendpoint to download tps data in csv format |
| --httpendpoint | Geth's RPC http endpoint |
| --report | Full path of csv report file which captures TPS data (default: "tps-report.csv") |
| --from | From block no. It is used to calculate TPS for a given block range |
| --to | To block no. It is used to calculate TPS for a given block range |
| --awsmetrics | It enables pushing TPS metrics to aws metrics |
| --awsregion | AWS region where tpsmonitor is running |
| --awsnetwork | AWS network name of quorum. It is used to form the metric name key |
| --awsinst | AWS instance name. It is used to form the metric name key |
| --prometheusport | It enables prometheus metrics. |
| --influxdb | enable Influxdb |
| --influxdb.endpoint | Influxdb endpoint (default: "http://localhost:8086") |
| --influxdb.token | Influxdb token or username:password (default: ":") |
| --influxdb.org | Influxdb org name. default is empty |
| --influxdb.bucket | Influxdb bucket or database name (default: "telegraf") |
| --influxdb.measurement | Influxdb measurement name (default: "quorum_tps") |
| --influxdb.tags | Influxdb tags (comma separated list of key=value pairs) (default: "system=quorum,comp=tps") |
| --help | Show help |
AWS - Cloudwatch metrics can be viewed under AWS cloudwatch > custom namespaces with namespace <network_name>-<instance_name>.
The metric details are as follows:
System=TpsMonitor| Metric name | Description |
|---|---|
| TPS | transactions per second |
| TxnCount | total transactions count |
| BlockCount | total block count |
Example:
tpsmonitor --httpendpoint http://52.77.226.85:23000/ --consensus raft --report tps-m.csv --port 7575 --prometheusport 2112 --awsmetrics --awsregion ap-southeast-1 --awsnetwork test-nw --awsinst 121.12.13.114
Displays TPS calculated in the console for new blocks as they are inserted to the chain.
Calculates TPS, total no of blocks and total no of transactions every second and saves these results to the report file.
If prometheus port is provided these metrics can be accessed from http://<host>:<prometheus port>/metrics. The metrics names are as follows:
Quorum_TransactionProcessing_TPSQuorum_TransactionProcessing_total_blocksQuorum_TransactionProcessing_total_transactionsExample: tpsmonitor --httpendpoint http://52.77.226.85:23000/ --consensus raft --report tps-m.csv --port 7575 --prometheusport 2112
Sample report:
head -20 tps-m.csv
localTime,refTime,TPS,TxnCount,BlockCount
06 May 2020 06:03:01,00:00:00:01,2134,128047,241
06 May 2020 06:03:02,00:00:00:02,2023,242871,479
06 May 2020 06:03:03,00:00:00:03,1958,352613,713
06 May 2020 06:03:04,00:00:00:04,1906,457647,937
06 May 2020 06:03:05,00:00:00:05,1880,564064,1163
Displays TPS calculated in the console for given range of historical blocks as they are read from the chain. Calculates TPS, total no of blocks and total no of transactions for every minute(for the given block range) and saves these results to the report file.
Example: tpsmonitor --httpendpoint http://52.77.226.85:23000/ --consensus raft --from 1 --to 10000 --report tps-m.csv --port 8888
TPS data (in CSV format) can be downloaded from the http endpoint.
http://<host>:<port>/tpsdata
sample output:
http://localhost:8888/tpsdata
localTime,refTime,TPS,TxnCount,BlockCount
06 May 2020 06:03:01,00:00:00:01,2134,128047,241
06 May 2020 06:03:02,00:00:00:02,2023,242871,479
06 May 2020 06:03:03,00:00:00:03,1958,352613,713
06 May 2020 06:03:04,00:00:00:04,1906,457647,937
06 May 2020 06:03:05,00:00:00:05,1880,564064,1163
FAQs
Unknown package
Did you know?

Socket for GitHub automatically highlights issues in each pull request and monitors the health of all your open source dependencies. Discover the contents of your packages and block harmful activity before you install or update your dependencies.

Security News
Socket's package search now displays weekly downloads for npm packages, helping developers quickly assess popularity and make more informed decisions.

Security News
A Stanford study reveals 9.5% of engineers contribute almost nothing, costing tech $90B annually, with remote work fueling the rise of "ghost engineers."

Research
Security News
Socket’s threat research team has detected six malicious npm packages typosquatting popular libraries to insert SSH backdoors.