Security News
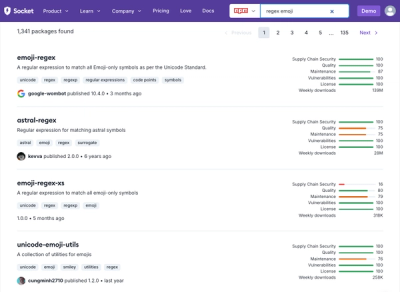
Weekly Downloads Now Available in npm Package Search Results
Socket's package search now displays weekly downloads for npm packages, helping developers quickly assess popularity and make more informed decisions.
github.com/open-telemetry/opentelemetry-go
OpenTelemetry-Go is the Go implementation of OpenTelemetry. It provides a set of APIs to directly measure performance and behavior of your software and send this data to observability platforms.
| Signal | Status |
|---|---|
| Traces | Stable |
| Metrics | Stable |
| Logs | Beta1 |
Progress and status specific to this repository is tracked in our project boards and milestones.
Project versioning information and stability guarantees can be found in the versioning documentation.
OpenTelemetry-Go ensures compatibility with the current supported versions of the Go language:
Each major Go release is supported until there are two newer major releases. For example, Go 1.5 was supported until the Go 1.7 release, and Go 1.6 was supported until the Go 1.8 release.
For versions of Go that are no longer supported upstream, opentelemetry-go will stop ensuring compatibility with these versions in the following manner:
Currently, this project supports the following environments.
| OS | Go Version | Architecture |
|---|---|---|
| Ubuntu | 1.23 | amd64 |
| Ubuntu | 1.22 | amd64 |
| Ubuntu | 1.23 | 386 |
| Ubuntu | 1.22 | 386 |
| Linux | 1.23 | arm64 |
| Linux | 1.22 | arm64 |
| macOS 13 | 1.23 | amd64 |
| macOS 13 | 1.22 | amd64 |
| macOS | 1.23 | arm64 |
| macOS | 1.22 | arm64 |
| Windows | 1.23 | amd64 |
| Windows | 1.22 | amd64 |
| Windows | 1.23 | 386 |
| Windows | 1.22 | 386 |
While this project should work for other systems, no compatibility guarantees are made for those systems currently.
You can find a getting started guide on opentelemetry.io.
OpenTelemetry's goal is to provide a single set of APIs to capture distributed traces and metrics from your application and send them to an observability platform. This project allows you to do just that for applications written in Go. There are two steps to this process: instrument your application, and configure an exporter.
To start capturing distributed traces and metric events from your application it first needs to be instrumented. The easiest way to do this is by using an instrumentation library for your code. Be sure to check out the officially supported instrumentation libraries.
If you need to extend the telemetry an instrumentation library provides or want to build your own instrumentation for your application directly you will need to use the Go otel package. The examples are a good way to see some practical uses of this process.
Now that your application is instrumented to collect telemetry, it needs an export pipeline to send that telemetry to an observability platform.
All officially supported exporters for the OpenTelemetry project are contained in the exporters directory.
| Exporter | Logs | Metrics | Traces |
|---|---|---|---|
| OTLP | ✓ | ✓ | ✓ |
| Prometheus | ✓ | ||
| stdout | ✓ | ✓ | ✓ |
| Zipkin | ✓ |
See the contributing documentation.
FAQs
Unknown package
Did you know?

Socket for GitHub automatically highlights issues in each pull request and monitors the health of all your open source dependencies. Discover the contents of your packages and block harmful activity before you install or update your dependencies.

Security News
Socket's package search now displays weekly downloads for npm packages, helping developers quickly assess popularity and make more informed decisions.

Security News
A Stanford study reveals 9.5% of engineers contribute almost nothing, costing tech $90B annually, with remote work fueling the rise of "ghost engineers."

Research
Security News
Socket’s threat research team has detected six malicious npm packages typosquatting popular libraries to insert SSH backdoors.