Security News
Research
Data Theft Repackaged: A Case Study in Malicious Wrapper Packages on npm
The Socket Research Team breaks down a malicious wrapper package that uses obfuscation to harvest credentials and exfiltrate sensitive data.
org.webjars.npm:pidusage
Advanced tools
Cross-platform process cpu % and memory usage of a PID
Ideas from https://github.com/arunoda/node-usage/ but with no C-bindings
Please note that if you need to check a nodejs script process cpu usage, you can use process.cpuUsage since node v6.1.0. This script remain useful when you have no control over the remote script, or if the process is not a nodejs process.
var pusage = require('pidusage')

// Compute statistics every second:

setInterval(function () {
    pusage.stat(process.pid, function (err, stat) {

	expect(err).to.be.null
	expect(stat).to.be.an('object')
	expect(stat).to.have.property('cpu')
	expect(stat).to.have.property('memory')

	console.log('Pcpu: %s', stat.cpu)
	console.log('Mem: %s', stat.memory) //those are bytes

    })
}, 1000)
When you're done with the given pid, you may want to clear pidusage history (it only keeps the last stat values):
pusage.unmonitor(process.pid);
If you need raw data you can use the advanced mode since 1.2.0:
pusage(process.pid, {advanced: true}, function (err, stat) {
  console.log(stat.time, stat.start)
})
The stat object will contain the following:
- `cpu` cpu percent
- `memory` memory bytes
- `time` user + system time
- `start` time process was started
A check on the os.platform is done to determine the method to use.
We use /proc/{pid}/stat in addition to the the PAGE_SIZE and the CLK_TCK direclty from getconf() command. Uptime comes from proc/uptime file because it's more accurate than the nodejs os.uptime().
/!\ As stated in #17, memory will increase when using pidusage.stat in an interval because of readFile. It will naturally be released by the garbage collector.
Cpu usage is computed by following those instructions. It keeps an history of the current processor time for the given pid so that the computed value gets more and more accurate. Don't forget to do unmonitor(pid) so that history gets cleared.
Cpu usage does not check the child process tree!
Memory result is representing the RSS (resident set size) only by doing rss*pagesize, where pagesize is the result of getconf PAGE_SIZE.
We use a fallback with the ps -o pcpu,rss -p PID command to get the same informations.
Memory usage will also display the RSS only, process cpu usage might differ from a distribution to another. Please check the correspoding man ps for more insights on the subject.
AIX is tricky because I have no AIX test environement, at the moment we use: ps -o pcpu,rssize -p PID but /proc results should be more accurate! If you're familiar with the AIX environment and know how to get the same results as we've got with Linux systems, please help.
#4
Windows is really tricky, atm it uses the wmic.exe: wmic PROCESS {PID} get workingsetsize,usermodetime,kernelmodetime.
The memory usage here is what windows calls the "Working Set":
Maximum number of bytes in the working set of this process at any point in time. The working set is the set of memory pages touched recently by the threads in the process. If free memory in the computer is above a threshold, pages are left in the working set of a process even if they are not in use. When free memory falls below a threshold, pages are trimmed from working sets. If they are needed, they are then soft-faulted back into the working set before they leave main memory.
The CPU usage is computed the same as it is on linux systems. We have the kernelmodetime and the usermodetime processor use. Every time pidusage.stat is called, we can calculate the processor usage according to the time spent between calls (uses os.uptime() internally).
Note that before we used wmic path Win32_PerfFormattedData_PerfProc_Process WHERE IDProcess= (which is slow as hell) and Win32_PerfRawData_PerfProc_Process (which api breaks on Windows 10 and Windows server 2012). Not every Windows bugged but just some of those. However, the wmic PROCESS call is faster, and safer as it must be used by internal programs since windows XP (this is clearly an assumption).
wmic?This is the safest implementation I've found that works on most Windows version (>= XP). I've tried many other implementations but there was always some failing test case. For example, powershell would be faster but powershell needs to be attached to a console (see this comment). This means it'd have to popup a new cmd.exe every time we execute pidusage.
If you know a way that doesn't imply the use of wmic, please open an issue so that I can try it!
If you want to compute a pidusage tree take a look at pidusage-tree.
MIT
FAQs
WebJar for pidusage
We found that org.webjars.npm:pidusage demonstrated a not healthy version release cadence and project activity because the last version was released a year ago. It has 0 open source maintainers collaborating on the project.
Did you know?

Socket for GitHub automatically highlights issues in each pull request and monitors the health of all your open source dependencies. Discover the contents of your packages and block harmful activity before you install or update your dependencies.

Security News
Research
The Socket Research Team breaks down a malicious wrapper package that uses obfuscation to harvest credentials and exfiltrate sensitive data.

Research
Security News
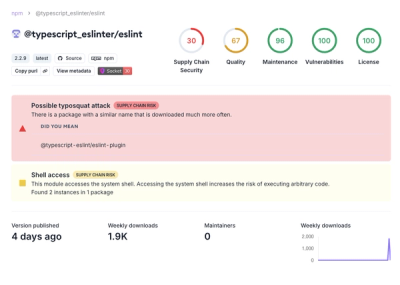
Attackers used a malicious npm package typosquatting a popular ESLint plugin to steal sensitive data, execute commands, and exploit developer systems.

Security News
The Ultralytics' PyPI Package was compromised four times in one weekend through GitHub Actions cache poisoning and failure to rotate previously compromised API tokens.