Security News
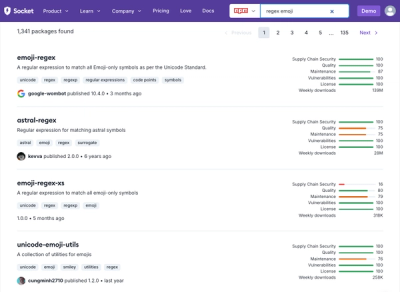
Weekly Downloads Now Available in npm Package Search Results
Socket's package search now displays weekly downloads for npm packages, helping developers quickly assess popularity and make more informed decisions.
@graph-paper/datagraphic
Advanced tools
FIXME: fill out more of this doc
The main parent component for data graphic generation.
<DataGraphic />xType (string, default linear) the type of x axis scale.
yType (string, default linear) the type of y axis scale.
width (number) the width of the graph in pixels. If omitted, the data
graphic will inflate to take up the width of the parent of DataGraphic.
height (number, default 300) the height of the graph in pixels. If
omitted, will default to 300. If passed in a value of null, the data graphic
will inflate to take up the height of the parent of DataGraphic.
left / right / top / bottom (number) the padding between the edge and
the plot body, in pixels
xMin / xMax (number) the x-axis min and max
xDomain (array of two numbers) an array that contains the min and max. If
omitted, will be generated from the children of DataGraphic. If xMin or
xMax are specified, these individually take precedence over their respective
values in xDomain.
yMin / yMax (number, optional) the y-axis min and max
yDomain (array of two numbers) an array that contains the min and max of the
y axis. If omitted, will be generated from the children of DataGraphic. If
yMin or yMax are specified, these individually take precedence over their
respective values in yDomain.
mousePosition FILL IN used primarily with bind
dataGraphicMounted FILL IN used primarily with bind
border - (boolean, default false) draw all the graphic borders, which
delineate the plot area from the margins. Render an individual border with
leftBorder, rightBorder, topBorder, and bottomBorder.
borderSize - (number, default 1) the thickness of the borders. Change a
side's border sizing with leftBorderSize, rightBorderSize,
topBorderSize, and bottomBorderSize. Requires border to be true.
borderColor - (string, default var(--cool-gray-200)) the color of the
borders. Change a side's border color with leftBorderColor,
rightBorderColor, topBorderColor, and bottomBorderColor. Requires
border to be true.
borderOpacity - (string, default var(--cool-gray-200)) the opacity of the
borders. Change a side's border opacity with leftBorderOpacity,
rightBorderOpacity, topBorderOpacity, and bottomBorderOpacity. Requires
border to be true.
All slots in DataGraphic fit within the SVG element, best utilized through g
tags, eg <g slot="body">...</g>. These slots constitute the fundamental layers
of a data graphic. They render in this order:
body-background a background layer clipped to the graphic bodybackground a background layer not clipped to the graphic bodybody the main layer, clipped to the graphic body areaannotation used for markers, annotations, and the likeinteraction used for user interactions like mouse events, scrubbing, etc.And they all contain the same slot props:
xScale the current x scale functionyScale the current y scale functionleft / right / top / bottom the padding between the edge of the plot
body, in pixelswidth the current width of the graph, in pixelsheight the current height of the graph, in pixelsmousePosition the current mouse position FILL THIS IN SOMEWHEREThese slot props allow users to mix and match Graph Paper components with custom ones / plain SVG.
The slots can be used in any way users prefer. The semantics of the slots are meant mostly to convey the order they render in.
Children of DataGraphic have a number of contexts available to them.
FIXME
FAQs
__DESCRIPTION_FORTHCOMING__
The npm package @graph-paper/datagraphic receives a total of 2 weekly downloads. As such, @graph-paper/datagraphic popularity was classified as not popular.
We found that @graph-paper/datagraphic demonstrated a not healthy version release cadence and project activity because the last version was released a year ago. It has 3 open source maintainers collaborating on the project.
Did you know?

Socket for GitHub automatically highlights issues in each pull request and monitors the health of all your open source dependencies. Discover the contents of your packages and block harmful activity before you install or update your dependencies.

Security News
Socket's package search now displays weekly downloads for npm packages, helping developers quickly assess popularity and make more informed decisions.

Security News
A Stanford study reveals 9.5% of engineers contribute almost nothing, costing tech $90B annually, with remote work fueling the rise of "ghost engineers."

Research
Security News
Socket’s threat research team has detected six malicious npm packages typosquatting popular libraries to insert SSH backdoors.