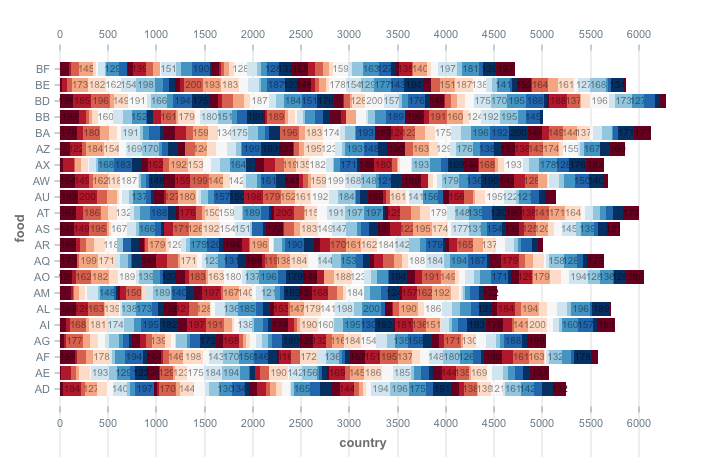
What is @nivo/bar?
@nivo/bar is a powerful and flexible library for creating bar charts in React applications. It provides a wide range of customization options and is built on top of D3.js, making it suitable for creating complex and interactive data visualizations.
What are @nivo/bar's main functionalities?
Basic Bar Chart
This code demonstrates how to create a basic bar chart using the @nivo/bar package. The chart displays values for different countries with customizable margins, padding, and axis labels.
import { ResponsiveBar } from '@nivo/bar';
const data = [
{ country: 'USA', value: 100 },
{ country: 'China', value: 200 },
{ country: 'Japan', value: 150 }
];
const MyBarChart = () => (
<ResponsiveBar
data={data}
keys={['value']}
indexBy='country'
margin={{ top: 50, right: 130, bottom: 50, left: 60 }}
padding={0.3}
colors={{ scheme: 'nivo' }}
axisBottom={{
tickSize: 5,
tickPadding: 5,
tickRotation: 0,
legend: 'Country',
legendPosition: 'middle',
legendOffset: 32
}}
axisLeft={{
tickSize: 5,
tickPadding: 5,
tickRotation: 0,
legend: 'Value',
legendPosition: 'middle',
legendOffset: -40
}}
/>
);
Grouped Bar Chart
This code demonstrates how to create a grouped bar chart using the @nivo/bar package. The chart displays multiple values for each country, grouped side by side.
import { ResponsiveBar } from '@nivo/bar';

const data = [
  { country: 'USA', valueA: 100, valueB: 80 },
  { country: 'China', valueA: 200, valueB: 150 },
  { country: 'Japan', valueA: 150, valueB: 120 }
];

const MyGroupedBarChart = () => (
  <ResponsiveBar
    data={data}
    keys={['valueA', 'valueB']}
    indexBy='country'
    margin={{ top: 50, right: 130, bottom: 50, left: 60 }}
    padding={0.3}
    groupMode='grouped'
    colors={{ scheme: 'nivo' }}
    axisBottom={{
      tickSize: 5,
      tickPadding: 5,
      tickRotation: 0,
      legend: 'Country',
      legendPosition: 'middle',
      legendOffset: 32
    }}
    axisLeft={{
      tickSize: 5,
      tickPadding: 5,
      tickRotation: 0,
      legend: 'Value',
      legendPosition: 'middle',
      legendOffset: -40
    }}
  />
);
Stacked Bar Chart
This code demonstrates how to create a stacked bar chart using the @nivo/bar package. The chart displays multiple values for each country, stacked on top of each other.
import { ResponsiveBar } from '@nivo/bar';

const data = [
  { country: 'USA', valueA: 100, valueB: 80 },
  { country: 'China', valueA: 200, valueB: 150 },
  { country: 'Japan', valueA: 150, valueB: 120 }
];

const MyStackedBarChart = () => (
  <ResponsiveBar
    data={data}
    keys={['valueA', 'valueB']}
    indexBy='country'
    margin={{ top: 50, right: 130, bottom: 50, left: 60 }}
    padding={0.3}
    groupMode='stacked'
    colors={{ scheme: 'nivo' }}
    axisBottom={{
      tickSize: 5,
      tickPadding: 5,
      tickRotation: 0,
      legend: 'Country',
      legendPosition: 'middle',
      legendOffset: 32
    }}
    axisLeft={{
      tickSize: 5,
      tickPadding: 5,
      tickRotation: 0,
      legend: 'Value',
      legendPosition: 'middle',
      legendOffset: -40
    }}
  />
);
Other packages similar to @nivo/bar
recharts
Recharts is a composable charting library built on React components. It provides a variety of chart types, including bar charts, and is known for its simplicity and ease of use. Compared to @nivo/bar, Recharts offers a more straightforward API but may lack some of the advanced customization options available in @nivo/bar.
victory
Victory is a modular charting library for React and React Native. It offers a wide range of chart types, including bar charts, and is designed to be highly customizable. Victory is comparable to @nivo/bar in terms of flexibility and customization, but it also supports React Native, which @nivo/bar does not.
chart.js
Chart.js is a popular JavaScript library for creating charts, including bar charts. It can be used with React through various wrapper libraries like react-chartjs-2. While Chart.js is not specifically designed for React, it is highly performant and offers a wide range of customization options. Compared to @nivo/bar, Chart.js may require more effort to integrate into a React application.


