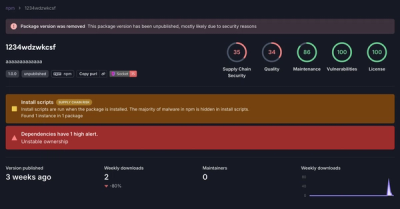
Research
Security News
Threat Actor Exposes Playbook for Exploiting npm to Build Blockchain-Powered Botnets
A threat actor's playbook for exploiting the npm ecosystem was exposed on the dark web, detailing how to build a blockchain-powered botnet.
@opentelemetry/sdk-metrics
Advanced tools
The @opentelemetry/sdk-metrics package is part of the OpenTelemetry JavaScript SDK, which provides tools for collecting and exporting metrics data from your applications. It allows you to create and manage various types of metrics such as counters, observers, and histograms, and to export this data to different backends for analysis and monitoring.
Creating a Meter
This feature allows you to create a Meter instance from the MeterProvider. The Meter is used to create and manage metrics.
{"const { MeterProvider } = require('@opentelemetry/sdk-metrics');
const meterProvider = new MeterProvider();
const meter = meterProvider.getMeter('your-meter-name');"}Creating a Counter Metric
This feature allows you to create a Counter metric, which can be used to record the number of times an event occurs.
{"const { MeterProvider } = require('@opentelemetry/sdk-metrics');
const meterProvider = new MeterProvider();
const meter = meterProvider.getMeter('your-meter-name');
const counter = meter.createCounter('requests', {
  description: 'Count of requests received'
});"}
Recording Metrics
This feature allows you to record metrics data. In this example, we increment the counter by 1 for the '/home' route.
{"const { MeterProvider } = require('@opentelemetry/sdk-metrics');
const meterProvider = new MeterProvider();
const meter = meterProvider.getMeter('your-meter-name');
const counter = meter.createCounter('requests');
counter.add(1, { route: '/home' });"}
Exporting Metrics
This feature allows you to export the collected metrics data. Here, we use the ConsoleMetricExporter to print metrics to the console at a regular interval.
{"const { MeterProvider } = require('@opentelemetry/sdk-metrics');
const { ConsoleMetricExporter } = require('@opentelemetry/exporter-metrics-console');
const meterProvider = new MeterProvider({
  exporter: new ConsoleMetricExporter(),
  interval: 1000
});
const meter = meterProvider.getMeter('your-meter-name');"}The prom-client package is a Prometheus client for Node.js that supports the creation, collection, and exposition of metrics data. It is similar to @opentelemetry/sdk-metrics in that it provides a way to collect metrics from your application, but it is specifically designed to work with Prometheus.
The metrics package provides a set of tools for collecting and reporting various types of metrics from your Node.js applications. It is similar to @opentelemetry/sdk-metrics but has a different API and does not integrate with the OpenTelemetry ecosystem.
Appmetrics is a package for monitoring and reporting runtime and performance metrics in Node.js applications. It offers functionality similar to @opentelemetry/sdk-metrics but is focused on providing built-in probes for various Node.js modules and runtime statistics.
This module contains the Metrics SDK of opentelemetry-js.
Used standalone, this module provides methods for manual instrumentation of code, offering full control over recording metrics for client-side JavaScript (browser) and Node.js.
It does not provide automated instrumentation of known libraries or host environment metrics out-of-the-box.
npm install --save @opentelemetry/api
npm install --save @opentelemetry/sdk-metrics
The basic setup of the SDK can be seen as followings:
const opentelemetry = require('@opentelemetry/api');
const { MeterProvider } = require('@opentelemetry/sdk-metrics');

// To create an instrument, you first need to initialize the Meter provider.
// NOTE: The default OpenTelemetry meter provider does not record any metric instruments.
//       Registering a working meter provider allows the API methods to record instruments.
opentelemetry.setGlobalMeterProvider(new MeterProvider());

// To record a metric event, we used the global singleton meter to create an instrument.
const counter = opentelemetry.getMeter('default').createCounter('foo');

// record a metric event.
counter.add(1, { attributeKey: 'attribute-value' });
In conditions, we may need to setup an async instrument to observe costly events:
// Creating an async instrument, similar to synchronous instruments
const observableCounter = opentelemetry.getMeter('default')
  .createObservableCounter('observable-counter');

// Register a single-instrument callback to the async instrument.
observableCounter.addCallback(async (observableResult) => {
  // ... do async stuff
  observableResult.observe(1, { attributeKey: 'attribute-value' });
});

// Register a multi-instrument callback and associate it with a set of async instruments.
opentelemetry.getMeter('default')
  .addBatchObservableCallback(batchObservableCallback, [ observableCounter ]);
async function batchObservableCallback(batchObservableResult) {
  // ... do async stuff
  batchObservableResult.observe(observableCounter, 1, { attributeKey: 'attribute-value' });
}
Views can be registered when instantiating a MeterProvider:
const meterProvider = new MeterProvider({
  views: [
    // override the bucket boundaries on `my.histogram` to [0, 50, 100]
    new View({ aggregation: new ExplicitBucketHistogramAggregation([0, 50, 100]), instrumentName: 'my.histogram'}),
    // rename 'my.counter' to 'my.renamed.counter'
    new View({ name: 'my.renamed.counter', instrumentName: 'my.counter'})
  ]
})
See examples/prometheus for an end-to-end example, including exporting metrics.
Apache 2.0 - See LICENSE for more information.
FAQs
OpenTelemetry metrics SDK
The npm package @opentelemetry/sdk-metrics receives a total of 5,683,067 weekly downloads. As such, @opentelemetry/sdk-metrics popularity was classified as popular.
We found that @opentelemetry/sdk-metrics demonstrated a healthy version release cadence and project activity because the last version was released less than a year ago. It has 3 open source maintainers collaborating on the project.
Did you know?

Socket for GitHub automatically highlights issues in each pull request and monitors the health of all your open source dependencies. Discover the contents of your packages and block harmful activity before you install or update your dependencies.

Research
Security News
A threat actor's playbook for exploiting the npm ecosystem was exposed on the dark web, detailing how to build a blockchain-powered botnet.

Security News
NVD’s backlog surpasses 20,000 CVEs as analysis slows and NIST announces new system updates to address ongoing delays.

Security News
Research
A malicious npm package disguised as a WhatsApp client is exploiting authentication flows with a remote kill switch to exfiltrate data and destroy files.