Chart.js Box and Violin Plot


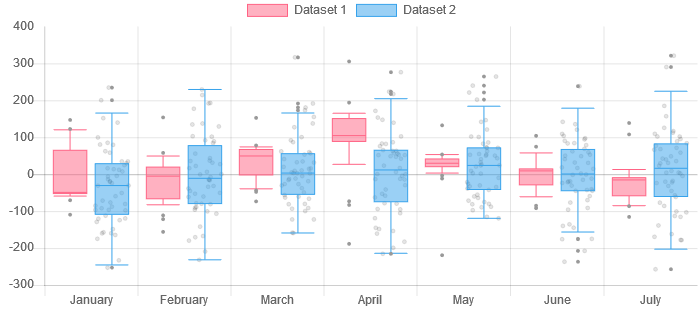
Chart.js module for charting box and violin plots.
Works only with Chart.js >= 3.0.0


Install
npm install --save chart.js@next @sgratzl/chartjs-chart-boxplot@next
Usage
see Samples on Github
and 
Chart
four new types: boxplot, horizontalBoxplot, violin, and horizontalViolin.
Config
The config can be done on a per dataset .data.datasets[0].minStats or for all datasets under the controllers name. e.g., .options.boxplot.datasets.minStats.
interface IBaseOptions {
minStats: 'min' | 'q1' | 'whiskerMin';
maxStats: 'max' | 'q3' | 'whiskerMax';
coef: number;
quantiles:
| 7
| 'quantiles'
| 'hinges'
| 'fivenum'
| 'linear'
| 'lower'
| 'higher'
| 'nearest'
| 'midpoint'
| ((sortedArr: number[]) => { min: number; q1: number; median: number; q3: number; max: number });
}
interface IBoxplotOptions extends IBaseOptions {
}
interface IViolinOptions extends IBaseOptions {
points: number;
}
interface IChartJSOptions {
boxplot: {
datasets: {};
};
}
Styling
The boxplot element is called boxandwhiskers. The basic options are from the rectangle element. The violin element is called violin also based on the rectangle element.
interface IBaseStyling {
backgroundColor: string;
borderColor: string;
borderWidth: number;
outlierStyle:
| 'circle'
| 'triangle'
| 'rect'
| 'rectRounded'
| 'rectRot'
| 'cross'
| 'crossRot'
| 'star'
| 'line'
| 'dash';
outlierRadius: number;
outlierBackgroundColor: string;
outlierBorderColor: string;
outlierBorderWidth: number;
itemStyle:
| 'circle'
| 'triangle'
| 'rect'
| 'rectRounded'
| 'rectRot'
| 'cross'
| 'crossRot'
| 'star'
| 'line'
| 'dash';
itemRadius: number;
itemBackgroundColor: string;
itemBorderColor: string;
itemBorderColor: number;
hitPadding: number;
outlierHitRadius: number;
}
interface IBoxPlotStyling extends IBaseStyling {
medianColor: string;
lowerBackgroundColor: string;
}
interface IViolinElementStyling extends IBaseStyling {
}
Data structure
Both types support that the data is given as an array of numbers number[]. The statistics will be automatically computed. In addition, specific summary data structures are supported:
interface IBaseItem {
min: number;
median: number;
max: number;
items?: number[];
}
interface IBoxPlotItem extends IBaseItem {
q1: number;
q3: number;
whiskerMin?: number;
whiskerMax?: number;
outliers?: number[];
}
interface IKDESamplePoint {
v: number;
estimate: number;
}
interface IViolinItem extends IBaseItem {
coords: IKDESamplePoint[];
}
Tooltips
In order to simplify the customization of the tooltips the tooltip item given to the tooltip callbacks was improved. The default toString() behavior should be fine in most cases. The tooltip item has the following structure:
interface ITooltipItem {
label: string;
value: {
raw: IBoxPlotItem | IViolinItem;
hoveredOutlierRadius: number;
toString(): string;
min: string;
median: string;
max: string;
items?: string[];
};
}
ESM and Tree Shaking
The ESM build of the library supports tree shaking thus having no side effects. As a consequence the chart.js library won't be automatically manipulated nor new controllers automatically registered. One has to manually import and register them.
Variant A:
import Chart from 'chart.js';
import { BoxPlotController } from '@sgratzl/chartjs-chart-boxplot';
BoxPlotController.register();
...
new Chart(ctx, {
type: BoxPlotController.id,
data: [...],
});
Variant B:
import { BoxPlotChart } from '@sgratzl/chartjs-chart-boxplot';

new BoxPlotChart(ctx, {
  data: [...],
});
Development Environment
npm i -g yarn
yarn set version 2.1.0
yarn
yarn pnpify --sdk vscode
Building
yarn install
yarn build
 developed by datavisyn.


