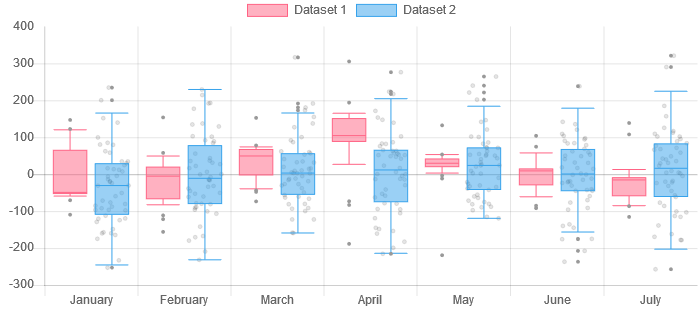
Chart.js Box and Violin Plot


Chart.js module for charting box and violin plots. This is a maintained fork of @datavisyn/chartjs-chart-box-and-violin-plot, which I originally developed during my time at datavisyn.


Related Plugins
Check out also my other chart.js plugins:
Install
npm install --save chart.js @sgratzl/chartjs-chart-boxplot
Usage
see Samples on Github
and 
Chart
four new types: boxplot and violin.
Config
The config can be done on a per dataset .data.datasets[0].minStats or for all datasets under the controllers name. e.g., .options.boxplot.datasets.minStats.
see https://github.com/sgratzl/chartjs-chart-boxplot/blob/dev/src/data.ts#L100-L147
Data structure
Both types support that the data is given as an array of numbers number[]. The statistics will be automatically computed. In addition, specific summary data structures are supported:
see https://github.com/sgratzl/chartjs-chart-boxplot/blob/dev/src/data.ts#L24-L49
Tooltips
In order to simplify the customization of the tooltips the tooltip item given to the tooltip callbacks was improved. The default toString() behavior should be fine in most cases. The tooltip item has the following structure:
interface ITooltipItem {
label: string;
value: {
raw: IBoxPlotItem | IViolinItem;
hoveredOutlierRadius: number;
toString(): string;
min: string;
median: string;
max: string;
items?: string[];
};
}
ESM and Tree Shaking
The ESM build of the library supports tree shaking thus having no side effects. As a consequence the chart.js library won't be automatically manipulated nor new controllers automatically registered. One has to manually import and register them.
Variant A:
import { Chart, LinearScale, CategoryScale } from 'chart.js';
import { BoxPlotController, BoxAndWiskers } from '@sgratzl/chartjs-chart-boxplot';
Chart.register(BoxPlotController, BoxAndWiskers, LinearScale, CategoryScale);
...
new Chart(ctx, {
type: 'boxplot',
data: [...],
});
Variant B:
import { BoxPlotChart } from '@sgratzl/chartjs-chart-boxplot';

new BoxPlotChart(ctx, {
  data: [...],
});
Development Environment
npm i -g yarn
yarn install
yarn sdks vscode
Common commands
yarn compile
yarn test
yarn lint
yarn fix
yarn build
yarn docs
Credits
Original credits belong to @datavisyn.


