Security News
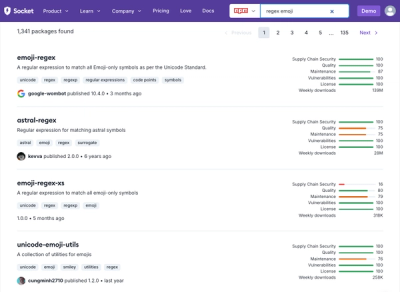
Weekly Downloads Now Available in npm Package Search Results
Socket's package search now displays weekly downloads for npm packages, helping developers quickly assess popularity and make more informed decisions.
@syncfusion/ej2-react-pivotview
Advanced tools
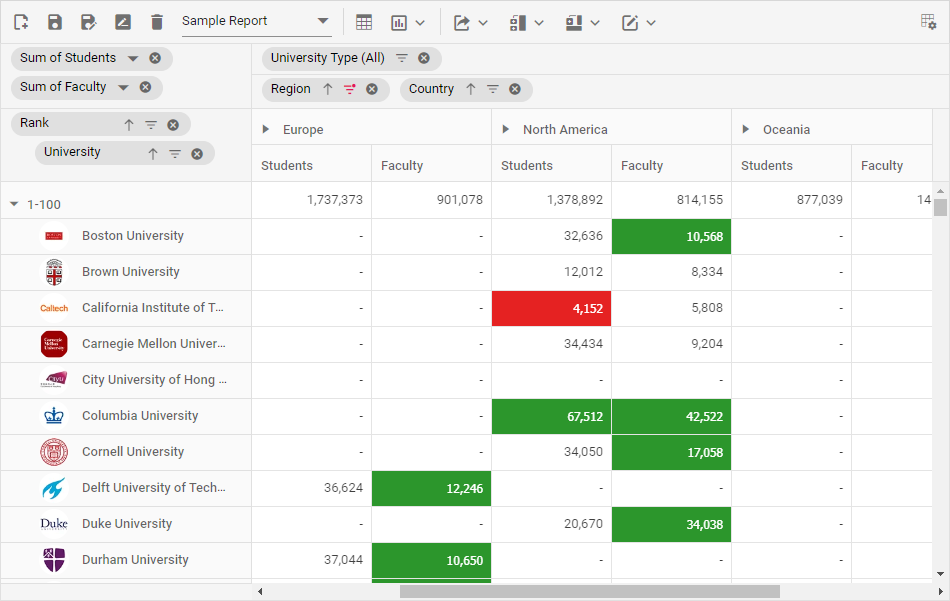
The pivot grid, or pivot table, is used to visualize large sets of relational data in a cross-tabular format, similar to an Excel pivot table. for React
The React Pivot Table is a multi-dimensional data visualization component built on top of relational and OLAP data sources. The pivot report can be managed dynamically at runtime, along with other features such as graphical visualization (Pivot Chart), drill down/up, aggregation, filtering, sorting, grouping, conditional formatting, drill through, editing, hyperlink, and more. The large amounts of data are effectively handled by virtualization or paging support.
Getting started . Online demos . Learn more

Trusted by the world's leading companies

You can use create-react-app to setup applications. To create React app, use the following command.
npx create-react-app my-app --template typescript
cd my-app
npm start
All Syncfusion React packages are published in the npmjs.com registry. To install the React Pivot Table package, use the following command.
npm install @syncfusion/ej2-react-pivotview --save
Add CSS references needed for a Pivot Table in src/App.css from the ../node_modules/@syncfusion package folder.
@import '../node_modules/@syncfusion/ej2-base/styles/material.css';
@import '../node_modules/@syncfusion/ej2-buttons/styles/material.css';
@import '../node_modules/@syncfusion/ej2-dropdowns/styles/material.css';
@import '../node_modules/@syncfusion/ej2-grids/styles/material.css';
@import '../node_modules/@syncfusion/ej2-inputs/styles/material.css';
@import '../node_modules/@syncfusion/ej2-lists/styles/material.css';
@import '../node_modules/@syncfusion/ej2-navigations/styles/material.css';
@import '../node_modules/@syncfusion/ej2-popups/styles/material.css';
@import '../node_modules/@syncfusion/ej2-splitbuttons/styles/material.css';
@import '../node_modules/@syncfusion/ej2-calendars/styles/material.css';
@import '../node_modules/@syncfusion/ej2-react-pivotview/styles/material.css';
In the src/App.tsx file, use the following code snippet to render the Syncfusion React Pivot Table component and import App.css to apply styles to the Pivot Table.
import { IDataSet, IDataOptions, PivotViewComponent } from '@syncfusion/ej2-react-pivotview';
import * as React from 'react';
import './App.css';

export default function App() {
    let pivotData: IDataSet[] = [
        { 'Sold': 31, 'Amount': 52824, 'Country': 'France', 'Products': 'Mountain Bikes', 'Year': 'FY 2015', 'Quarter': 'Q1' },
        { 'Sold': 51, 'Amount': 86904, 'Country': 'France', 'Products': 'Mountain Bikes', 'Year': 'FY 2015', 'Quarter': 'Q2' },
        { 'Sold': 90, 'Amount': 153360, 'Country': 'France', 'Products': 'Mountain Bikes', 'Year': 'FY 2015', 'Quarter': 'Q3' },
        { 'Sold': 25, 'Amount': 42600, 'Country': 'France', 'Products': 'Mountain Bikes', 'Year': 'FY 2015', 'Quarter': 'Q4' },
        { 'Sold': 27, 'Amount': 46008, 'Country': 'France', 'Products': 'Mountain Bikes', 'Year': 'FY 2016', 'Quarter': 'Q1' }
    ];
    let dataSourceSettings: IDataOptions = {
        columns: [{ name: 'Year', caption: 'Production Year' }, { name: 'Quarter' }],
        dataSource: pivotData,
        expandAll: false,
        filters: [],
        formatSettings: [{ name: 'Amount', format: 'C0' }],
        rows: [{ name: 'Country' }, { name: 'Products' }],
        values: [{ name: 'Sold', caption: 'Units Sold' }, { name: 'Amount', caption: 'Sold Amount' }]
    };
    return <PivotViewComponent id='PivotView' height={350} dataSourceSettings={this.dataSourceSettings}></PivotViewComponent>
}
Pivot Table component is also offered in the following list of frameworks.
 JavaScript |  Angular |  Vue |  ASP.NET Core |  ASP.NET MVC |
|---|
Product support is available through the following mediums.
Check the changelog here. Get minor improvements and bug fixes every week to stay up to date with frequent updates.
This is a commercial product and requires a paid license for possession or use. Syncfusion’s licensed software, including this component, is subject to the terms and conditions of Syncfusion's EULA. To acquire a license for 80+ React UI components, you can purchase or start a free 30-day trial.
A free community license is also available for companies and individuals whose organizations have less than $1 million USD in annual gross revenue and five or fewer developers.
See LICENSE FILE for more info.
© Copyright 2024 Syncfusion, Inc. All Rights Reserved. The Syncfusion Essential Studio license and copyright applies to this distribution.
FAQs
The pivot grid, or pivot table, is used to visualize large sets of relational data in a cross-tabular format, similar to an Excel pivot table. for React
The npm package @syncfusion/ej2-react-pivotview receives a total of 2,264 weekly downloads. As such, @syncfusion/ej2-react-pivotview popularity was classified as popular.
We found that @syncfusion/ej2-react-pivotview demonstrated a healthy version release cadence and project activity because the last version was released less than a year ago. It has 0 open source maintainers collaborating on the project.
Did you know?

Socket for GitHub automatically highlights issues in each pull request and monitors the health of all your open source dependencies. Discover the contents of your packages and block harmful activity before you install or update your dependencies.

Security News
Socket's package search now displays weekly downloads for npm packages, helping developers quickly assess popularity and make more informed decisions.

Security News
A Stanford study reveals 9.5% of engineers contribute almost nothing, costing tech $90B annually, with remote work fueling the rise of "ghost engineers."

Research
Security News
Socket’s threat research team has detected six malicious npm packages typosquatting popular libraries to insert SSH backdoors.