Chart.js Venn Diagram Chart


Chart.js module for charting venn diagrams with oen, two, or three sets. Adding new chart type: venn.
Works only with Chart.js >= 3.0.0
Install
npm install --save chart.js@next chartjs-chart-venn@next
Usage
see Samples on Github
or at this 
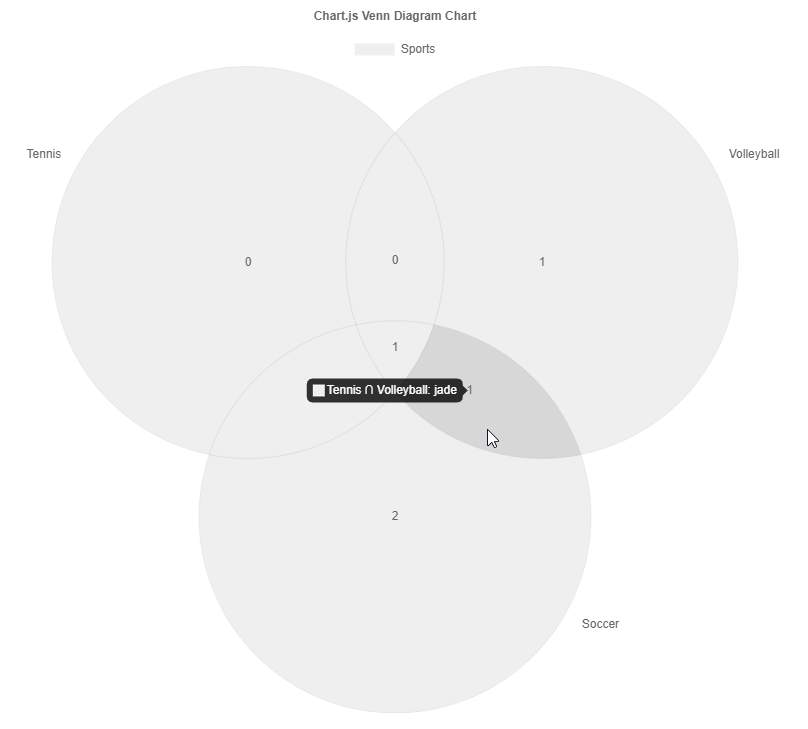
Venn Diagram
Data Structure
const config = {
  type: 'venn',
  data: ChartVenn.extractSets(
    [
      { label: 'Soccer', values: ['alex', 'casey', 'drew', 'hunter'] },
      { label: 'Tennis', values: ['casey', 'drew', 'jade'] },
      { label: 'Volleyball', values: ['drew', 'glen', 'jade'] },
    ],
    {
      label: 'Sports',
    }
  ),
  options: {},
};
Styling of elements
ArcSlice elements have the basic backgroundColor, borderColor, and borderWidth properties similar to a regular Rectangle.
ESM and Tree Shaking
The ESM build of the library supports tree shaking thus having no side effects. As a consequence the chart.js library won't be automatically manipulated nor new controllers automatically registered. One has to manually import and register them.
Variant A:
import Chart from 'chart.js';
import { VennDiagramController } from 'chartjs-chart-venn';
VennDiagramController.register();
...
new Chart(ctx, {
type: VennDiagramController.id,
data: [...],
});
Variant B:
import { VennDiagramChart } from 'chartjs-chart-pcp';

new VennDiagramChart(ctx, {
  data: [...],
});
Development Environment
npm i -g yarn
yarn set version 2
cat .yarnrc_patch.yml >> .yarnrc.yml
yarn
yarn pnpify --sdk
Common commands
yarn compile
yarn test
yarn lint
yarn fix
yarn build
yarn docs
yarn release
yarn release:pre


