Security News
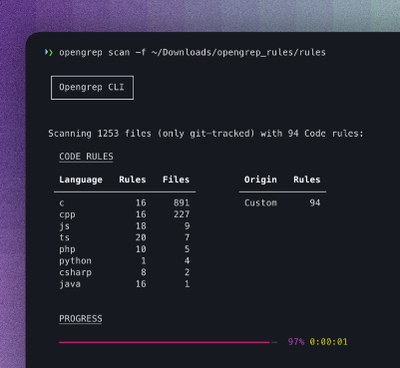
Opengrep Emerges as Open Source Alternative Amid Semgrep Licensing Controversy
Opengrep forks Semgrep to preserve open source SAST in response to controversial licensing changes.
graphology
Advanced tools
Graphology is a robust and versatile JavaScript library for creating, manipulating, and analyzing graphs. It provides a comprehensive set of tools for working with both directed and undirected graphs, and supports various graph algorithms and data structures.
Graph Creation
This feature allows you to create a new graph, add nodes, and add edges between nodes. The code sample demonstrates creating a graph, adding two nodes ('John' and 'Jane'), and adding an edge between them.
const Graph = require('graphology');
const graph = new Graph();
graph.addNode('John');
graph.addNode('Jane');
graph.addEdge('John', 'Jane');
console.log(graph.nodes()); // ['John', 'Jane']
console.log(graph.edges()); // [{ source: 'John', target: 'Jane' }]Graph Algorithms
Graphology supports various graph algorithms, such as Dijkstra's shortest path algorithm. The code sample demonstrates creating a graph with weighted edges and finding the shortest path from node 'A' to node 'C'.
const Graph = require('graphology');
const { dijkstra } = require('graphology-shortest-path');
const graph = new Graph();
graph.addNode('A');
graph.addNode('B');
graph.addNode('C');
graph.addEdge('A', 'B', { weight: 1 });
graph.addEdge('B', 'C', { weight: 2 });
graph.addEdge('A', 'C', { weight: 4 });
const path = dijkstra(graph, 'A', 'C');
console.log(path); // ['A', 'B', 'C']
Graph Analysis
Graphology provides tools for analyzing graphs, such as calculating centrality metrics. The code sample demonstrates creating a graph and calculating the degree centrality of each node.
const Graph = require('graphology');
const { degreeCentrality } = require('graphology-metrics/centrality');
const graph = new Graph();
graph.addNode('A');
graph.addNode('B');
graph.addNode('C');
graph.addEdge('A', 'B');
graph.addEdge('B', 'C');
graph.addEdge('A', 'C');
const centrality = degreeCentrality(graph);
console.log(centrality); // { A: 2, B: 2, C: 2 }Cytoscape.js is a graph theory library for visualization and analysis. It is highly optimized for large graphs and provides a rich set of features for graph manipulation and visualization. Compared to Graphology, Cytoscape.js is more focused on visualization and interactive graph exploration.
vis-network is a dynamic, browser-based visualization library for network graphs. It allows for interactive exploration and manipulation of graphs. While Graphology focuses on graph data structures and algorithms, vis-network emphasizes visualization and user interaction.
Sigma is a JavaScript library dedicated to graph drawing. It provides a simple way to visualize graphs and supports various layout algorithms. Sigma is more focused on rendering and visualizing graphs, whereas Graphology provides a more comprehensive set of tools for graph manipulation and analysis.
graphology is a specification for a robust & multipurpose JavaScript Graph object and aiming at supporting various kinds of graphs under a same unified interface.
You will also find here the source for the reference implementation of this specification.
Full documentation for the library/specs is available here.
0.26.0 (provisional)
obliterator dependency.Array.from.FAQs
A robust and multipurpose Graph object for JavaScript.
We found that graphology demonstrated a healthy version release cadence and project activity because the last version was released less than a year ago. It has 0 open source maintainers collaborating on the project.
Did you know?

Socket for GitHub automatically highlights issues in each pull request and monitors the health of all your open source dependencies. Discover the contents of your packages and block harmful activity before you install or update your dependencies.

Security News
Opengrep forks Semgrep to preserve open source SAST in response to controversial licensing changes.

Security News
Critics call the Node.js EOL CVE a misuse of the system, sparking debate over CVE standards and the growing noise in vulnerability databases.

Security News
cURL and Go security teams are publicly rejecting CVSS as flawed for assessing vulnerabilities and are calling for more accurate, context-aware approaches.