
Security News
Oracle Drags Its Feet in the JavaScript Trademark Dispute
Oracle seeks to dismiss fraud claims in the JavaScript trademark dispute, delaying the case and avoiding questions about its right to the name.
By Sarah Gooding - Feb 07, 2025
handsontable
Advanced tools
Spreadsheet-like data grid editor that provides copy/paste functionality compatible with Excel/Google Docs
Handsontable is a JavaScript/HTML5 data grid component with a spreadsheet look & feel. It is designed to handle large volumes of data and provides a wide range of features for data manipulation and visualization.
Data Grid
Handsontable provides a powerful data grid component that can be easily integrated into web applications. The code sample demonstrates how to create a basic data grid with row and column headers.
const container = document.getElementById('example');
const hot = new Handsontable(container, {
data: Handsontable.helper.createSpreadsheetData(6, 10),
rowHeaders: true,
colHeaders: true
});Data Validation
Handsontable supports data validation to ensure that the data entered into the grid meets certain criteria. The code sample shows how to set up a numeric validator for an 'age' column.
const hot = new Handsontable(container, {
  data: Handsontable.helper.createSpreadsheetData(6, 10),
  columns: [
    {data: 'id', type: 'numeric'},
    {data: 'name', type: 'text'},
    {data: 'age', type: 'numeric', validator: (value) => value > 0}
  ],
  rowHeaders: true,
  colHeaders: true
});
Custom Cell Rendering
Handsontable allows for custom cell rendering, enabling developers to change the appearance of cells based on their data. The code sample demonstrates how to change the background color of cells in the 'age' column if the value is greater than 50.
const hot = new Handsontable(container, {
  data: Handsontable.helper.createSpreadsheetData(6, 10),
  columns: [
    {data: 'id', type: 'numeric'},
    {data: 'name', type: 'text'},
    {data: 'age', type: 'numeric'}
  ],
  cells: function (row, col) {
    const cellProperties = {};
    if (col === 2) {
      cellProperties.renderer = function (instance, td, row, col, prop, value, cellProperties) {
        Handsontable.renderers.TextRenderer.apply(this, arguments);
        if (value > 50) {
          td.style.backgroundColor = 'red';
        }
      };
    }
    return cellProperties;
  },
  rowHeaders: true,
  colHeaders: true
});AG Grid is a fully-featured and highly customizable JavaScript data grid. It offers a wide range of features similar to Handsontable, such as data sorting, filtering, and editing. AG Grid is known for its performance and flexibility, making it suitable for large datasets and complex use cases.
React Table is a lightweight, fast, and extendable data grid built for React applications. It provides basic features like sorting, filtering, and pagination. Compared to Handsontable, React Table is more focused on being a simple and flexible solution for React developers, without the spreadsheet-like features.
SlickGrid is a JavaScript grid/spreadsheet component that is known for its performance with large datasets. It offers features like virtual scrolling and column resizing. While it provides similar functionalities to Handsontable, it is more focused on performance and less on providing a spreadsheet-like experience.
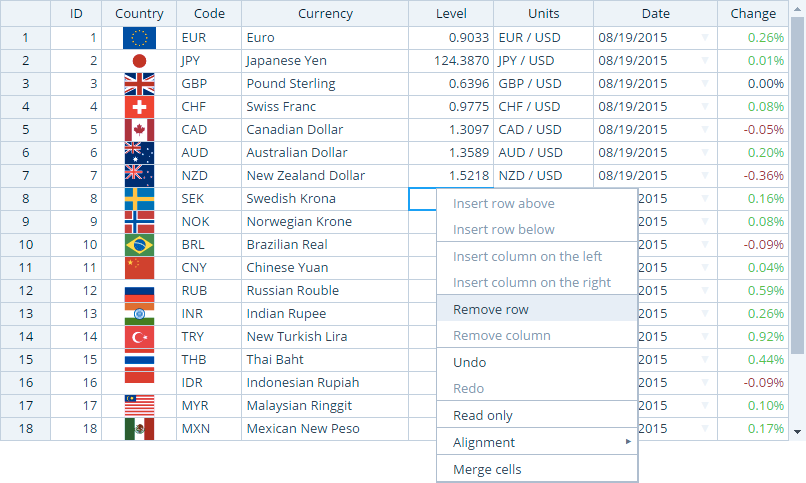
Handsontable is a pure JavaScript/HTML5 spreadsheet component with an Excel-like appearance. It can easily integrate with any data source and comes with a variety of useful features like data binding, validation, sorting or powerful custom context menu. Actively supported by the Handsoncode team team and many contributors.


We have seen Handsontable being used in many different, sometimes completely unexpected fields. The list below is just to give you a rough idea on what you can do with Handsontable, but it doesn't limit you in any way.
There are many ways to install Handsontable but we suggest using one of available package managers.
npm install handsontable --save
or
bower install handsontable --save
If you use a modular script loader then you can require Handsontable just like any other module:
require(['handsontable'], function(Handsontable) {
    var hot = new Handsontable(document.getElementById('example'), {
      data: [[1, 2, 3, 4], [1, 2, 3, 4]]
    });
});
If you use a CommonJS compatible environment you can use the require function to import Handsontable:
var handsontable = require('handsontable');
To bundle Handsontable with Browserify you must specify the module names of all required modules:
browserify main.js -o bundle.js -r moment -r pikaday -r zeroclipboard -r numbro
Assuming you have already installed Handsontable, add an empty <div> element that will be turned into a spreadsheet:
<div id="example"></div>
In the next step, pass a reference to that <div> element and fill it with sample data:
var data = [
  ["", "Ford", "Volvo", "Toyota", "Honda"],
  ["2016", 10, 11, 12, 13],
  ["2017", 20, 11, 14, 13],
  ["2018", 30, 15, 12, 13]
];

var container = document.getElementById('example');
var hot = new Handsontable(container, {
  data: data,
  rowHeaders: true,
  colHeaders: true
});
Handsontable Pro is a commercial spreadsheet solution packed with additional, business-ready features. It comes with a dedicated support and a forum support, where you can find the answers to common questions.
| Pro Feature | Description |
|---|---|
| Binding rows with headers | Bind rows with headers to lock the row number and always display one beside the other. |
| Collapsing columns | Expand and collapse columns to better fit the content. |
| Column summary | Carry out pre-defined calculations and display the results in Handsontable. |
| Dropdown menu | Add a menu to the heading to enable additional operations for the columns. |
| Export to file | Export data to a flat file like CSV or a string. |
| Filtering | Display rows that meet your criteria and hide the rest. |
| Gantt Chart | Create a simple Gantt Chart using Handsontable. |
| Header tooltips | Display the header label in a tooltip. |
| Hiding columns | Hide specific columns and show the rest. |
| Hiding rows | Hide specific rows and show the rest. |
| Nested headers | Create a nested, hierarchical structure of headers to get your data into groups. |
| Trimming rows | Exclude specific rows from the rendering process so they won't be displayed. |
Have questions regarding the Pro version? Contact us or take a look at the Frequently Asked Questions.
If you would like to help us in writing the code, please take a look into CONTRIBUTING.md
Handsontable is released under the MIT license.
Copyrights belong to Handsoncode sp. z o.o.
FAQs
Handsontable is a JavaScript Data Grid available for React, Angular and Vue.
The npm package handsontable receives a total of 46,779 weekly downloads. As such, handsontable popularity was classified as popular.
We found that handsontable demonstrated a healthy version release cadence and project activity because the last version was released less than a year ago. It has 0 open source maintainers collaborating on the project.
Did you know?

Socket for GitHub automatically highlights issues in each pull request and monitors the health of all your open source dependencies. Discover the contents of your packages and block harmful activity before you install or update your dependencies.
Security News
Oracle seeks to dismiss fraud claims in the JavaScript trademark dispute, delaying the case and avoiding questions about its right to the name.

Security News
The Linux Foundation is warning open source developers that compliance with global sanctions is mandatory, highlighting legal risks and restrictions on contributions.

Security News
Maven Central now validates Sigstore signatures, making it easier for developers to verify the provenance of Java packages.