Security News
Research
Data Theft Repackaged: A Case Study in Malicious Wrapper Packages on npm
The Socket Research Team breaks down a malicious wrapper package that uses obfuscation to harvest credentials and exfiltrate sensitive data.
hardhat-tracer
Advanced tools
Allows you to see events, calls and storage operations when running your tests.
Step 1: Install the package
npm i hardhat-tracer
Step 2: Add to your hardhat.config.js file
require("hardhat-tracer");
npx hardhat test --traceError # prints calls for failed txs
npx hardhat test --fulltraceError # prints calls and storage ops for failed txs
npx hardhat test --trace # prints calls for all txs
npx hardhat test --fulltrace # prints calls and storage ops for all txs

npx hardhat test --v    # same as --traceError
npx hardhat test --vv   # same as --fulltraceError
npx hardhat test --vvv  # same as --trace
npx hardhat test --vvvv # same as --fulltrace

# specify opcode
npx hardhat test --v --opcodes ADD,SUB   # shows any opcode specified for only failed txs
npx hardhat test --vvv --opcodes ADD,SUB # shows any opcode specified for all txs

You can just enable trace some code snippet in your tests:
hre.tracer.enabled = true;
await myContract.doStuff(val2);
hre.tracer.enabled = false;
You can trace a mainnet transaction and ABIs/artifacts in your project and 4byte directory will be used to decode the internal message calls.
npx hardhat trace --hash 0xTransactionHash # works if mainnet fork is on
npx hardhat trace --hash 0xTransactionHash --rpc https://url # must be archive node
Note: you can also use state overrides to override any state, e.g. things like adding console logs to the contracts involved in the trace or change balances.
You can trace a call on mainnet and ABIs/artifacts in your project and 4byte directory will be used to decode the internal message calls.
npx hardhat tracecall --to 0xAddr --data 0xData --from 0xAddr --value 123 # works if mainnet fork is on
npx hardhat tracecall --to 0xAddr --data 0xData --opcodes SLOAD --rpc https://url --blocknumber 1200000 # must be archive node
Note: you can also use state overrides to override any state, e.g. things like adding console logs to the contracts involved in the trace or change balances.
If you are just looking for a quick decode of calldata, return data or Solidity"s Custom Error:
$ npx hardhat decode --data 0x095ea7b300000000000000000000000068b3465833fb72a70ecdf485e0e4c7bd8665fc45ffffffffffffffffffffffffffffffffffffffffffffffffffffffffffffffff
ERC20.approve(spender=0x68b3465833fb72A70ecDF485E0e4C7bD8665Fc45, amount=115792089237316195423570985008687907853269984665640564039457584007913129639935)


$ npx hardhat decode --data 0x3850c7bd --returndata 0x000000000000000000000000000000000000000000024d0fa9cd4ba6ff769172fffffffffffffffffffffffffffffffffffffffffffffffffffffffffffcdea1000000000000000000000000000000000000000000000000000000000000a244000000000000000000000000000000000000000000000000000000000000ff78000000000000000000000000000000000000000000000000000000000000ffff00000000000000000000000000000000000000000000000000000000000000000000000000000000000000000000000000000000000000000000000000000001

IUniswapV3Pool.slot0() => (sqrtPriceX96: 2781762795090269932261746, tick: -205151, observationIndex: 41540, observationCardinality: 65400, observationCardinalityNext: 65535, feeProtocol: 0, unlocked: true)
For decoding logs
$ npx hardhat decodelog 0xddf252ad1be2c89b69c2b068fc378daa952ba7f163c4a11628f55a4df523b3ef 0xdCB90A71Db48D673A9A483c9F355EBaE93F66A86 0x0D0707963952f2fBA59dD06f2b425ace40b492Fe --data 0x00000000000000000000000000000000000000000000054b40b1f852bd800000
Transfer(src: 0xdCB90A71Db48D673A9A483c9F355EBaE93F66A86, dst: 0x0D0707963952f2fBA59dD06f2b425ace40b492Fe, wad: 24999999999999997902848)
You can set display names / name tags for unknown addresses by adding new entry to hre.tracer.nameTags object in your test cases, see following example:
hre.tracer.nameTags[this.arbitrager.address] = "Arbitrager";
or can be set in hardhat config
tracer: {
  nameTags: {
    "0xf39fd6e51aad88f6f4ce6ab8827279cfffb92266": "Hunter",
    [someVariable]: "MyContract",
  },
},
These state overrides are applied when the EthereumJS/VM is created inside hardhat.
tracer: {
  stateOverrides: {
    "0xC02aaA39b223FE8D0A0e5C4F27eAD9083C756Cc2": {
      storage: {
        "0": 100,
        "0x1abf42a573070203916aa7bf9118741d8da5f9522f66b5368aa0a2644f487b38": 0,
      },
      bytecode: "0x30FF",
      balance: parseEther("2"),
      nonce: 2
    },
    [someAddress]: {
      bytecode: "MyContract" // will compile and use the bytecode and link any libraries needed
    }
  },
},
Allows to add a test case to check whether last tx did an internal message call.
expect(hre.tracer.lastTrace()).to.have.messageCall(
  await contract.populateTransaction.getData(),
  {
    returnData: defaultAbiCoder.encode(["uint"], ["1234"]),
    from: otherContract.address,
    isDelegateCall: true,
    isStaticCall: true,
    isSuccess: true,
  }
);
You can programatically access detail information about previous traces in your test cases.
import {CallItem} from 'hardhat-tracer'

// can be a read call, estimate gas, write tx
await contract.method()

// traverse to the right location in the trace and extract the gasUsed
const trace1 = hre.tracer.lastTrace()!;
const callItem = trace1.top?.children?.[0].children?.[0] as CallItem;
const gasUsed = callItem.params.gasUsed!;
If you are running npx hardhat node --trace, then you can also access last trace using the rpc call tracer_lastTrace.
--trace option to custom tasks// hardhat config
tracer: {
tasks: ["deploy", "mycooltask"],
},
This allows to run
npx hardhat deploy --trace
npx hardhat mycooltask --trace
Please note that hardhat-tracer will only be able to print trace for things that run on the EthereumJS VM inside Hardhat Network. So if your custom task is executing evm code somewhere else e.g. deploying on live network (instead of hardhat network), then this option would not be able to print trace.
Set the DEBUG env variable to hardhat-tracer:*. This will print debug logs related to internal logic in hardhat-tracer for debugging purposes.
DEBUG=hardhat-tracer:* npx hardhat test --trace
List of supported configs is available in TracerEnvUser.
FAQs
Hardhat Tracer plugin
The npm package hardhat-tracer receives a total of 7,752 weekly downloads. As such, hardhat-tracer popularity was classified as popular.
We found that hardhat-tracer demonstrated a healthy version release cadence and project activity because the last version was released less than a year ago. It has 1 open source maintainer collaborating on the project.
Did you know?

Socket for GitHub automatically highlights issues in each pull request and monitors the health of all your open source dependencies. Discover the contents of your packages and block harmful activity before you install or update your dependencies.

Security News
Research
The Socket Research Team breaks down a malicious wrapper package that uses obfuscation to harvest credentials and exfiltrate sensitive data.

Research
Security News
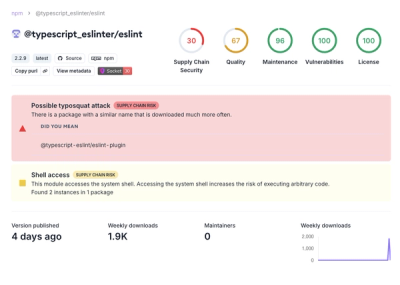
Attackers used a malicious npm package typosquatting a popular ESLint plugin to steal sensitive data, execute commands, and exploit developer systems.

Security News
The Ultralytics' PyPI Package was compromised four times in one weekend through GitHub Actions cache poisoning and failure to rotate previously compromised API tokens.