Security News
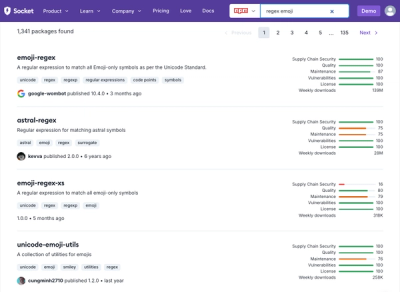
Weekly Downloads Now Available in npm Package Search Results
Socket's package search now displays weekly downloads for npm packages, helping developers quickly assess popularity and make more informed decisions.
nice-grpc-prometheus
Advanced tools
Prometheus monitoring for nice-grpc. Uses prom-client. Metrics mostly mimic go-grpc-prometheus.
npm install nice-grpc-prometheus
Import nice-grpc-prometheus metrics registry and
merge it with the global registry:
import {register as globalRegistry, Registry} from 'prom-client';
import {registry as niceGrpcRegistry} from 'nice-grpc-prometheus';

// use `await mergedRegistry.metrics()` to export all metrics
const mergedRegistry = Registry.merge([globalRegistry, niceGrpcRegistry]);
Attach middleware as the first one on the server:
import {createServer} from 'nice-grpc';
import {prometheusServerMiddleware} from 'nice-grpc-prometheus';

const server = createServer()
  .use(prometheusServerMiddleware())
  .use(/* ... other middleware */);
Attach middleware as the first one on the client:
import {createClientFactory} from 'nice-grpc';
import {prometheusClientMiddleware} from 'nice-grpc-prometheus';

const clientFactory = createClientFactory()
  .use(prometheusClientMiddleware())
  .use(/* ... other middleware */);

const client = clientFactory.create(/* ... */);
Following metrics are provided:
| Name | Type | Description | Labels |
|---|---|---|---|
grpc_server_started_total | Counter | Total number of RPCs started on the server. | Common (see below) |
grpc_server_handled_total | Counter | Total number of RPCs completed on the server, regardless of success or failure. | Common + grpc_code |
grpc_server_msg_received_total | Counter | Total number of RPC stream messages received by the server. | Common |
grpc_server_msg_sent_total | Counter | Total number of gRPC stream messages sent by the server. | Common |
grpc_server_handling_seconds | Histogram | Histogram of response latency (seconds) of gRPC that had been application-level handled by the server. | Common + grpc_code |
| Name | Type | Description | Labels |
|---|---|---|---|
grpc_client_started_total | Counter | Total number of RPCs started on the client. | Common |
grpc_client_handled_total | Counter | Total number of RPCs completed on the client, regardless of success or failure. | Common + grpc_code |
grpc_client_msg_received_total | Counter | Total number of RPC stream messages received by the client. | Common |
grpc_client_msg_sent_total | Counter | Total number of gRPC stream messages sent by the client. | Common |
grpc_client_handling_seconds | Histogram | Histogram of response latency (seconds) of the gRPC until it is finished by the application. | Common + grpc_code |
Common labels:
| Name | Description | Examples |
|---|---|---|
grpc_type | Call type | unary, server_stream, client_stream, bidi_stream |
grpc_path | Full path of a method | /my.package.MyService/MyMethod |
grpc_service | Full service name with package | my.package.MyService |
grpc_method | Method name | MyMethod |
Metrics that correspond to finished calls have extra label:
| Name | Description | Examples |
|---|---|---|
grpc_code | Status code name | OK, CANCELLED, NOT_FOUND |
You can use your own metric instances. This can be useful for example if you want to use your own buckets in histograms.
import {createClientFactory} from 'nice-grpc';
import {
  labelNamesWithCode,
  prometheusClientMiddleware,
} from 'nice-grpc-prometheus';
import {Histogram, Registry} from 'prom-client';

const registry = new Registry();

const clientHandlingSecondsMetric = new Histogram({
  registers: [registry],
  name: 'custom_grpc_client_handling_seconds',
  help: 'Custom histogram of response latency (seconds) of the gRPC until it is finished by the application.',
  labelNames: labelNamesWithCode,
  buckets: [0.1, 0.5, 1, 2, 3, 5, 10],
});

const clientFactory = createClientFactory()
  .use(prometheusClientMiddleware({clientHandlingSecondsMetric}))
  .use(/* ... other middleware */);
Don't forget to merge new registry with the global registry or use default registry instead.
Client middleware options:
{
  clientStartedMetric?: Counter; // labelNames: labelNames
  clientHandledMetric?: Counter; // labelNames: labelNamesWithCode
  clientStreamMsgReceivedMetric?: Counter; // labelNames: labelNames
  clientStreamMsgSentMetric?: Counter; // labelNames: labelNames
  clientHandlingSecondsMetric?: Histogram; // labelNames: labelNamesWithCode
}
Server middleware options:
{
  serverStartedMetric?: Counter; // labelNames: labelNames
  serverHandledMetric?: Counter; // labelNames: labelNamesWithCode
  serverStreamMsgReceivedMetric?: Counter; // labelNames: labelNames
  serverStreamMsgSentMetric?: Counter; // labelNames: labelNames
  serverHandlingSecondsMetric?: Histogram; // labelNames: labelNamesWithCode
}
Caution: Use the labelNames specified in the comment. Using incorrect labelNames may cause errors now or in the future.
FAQs
Prometheus monitoring for nice-grpc
The npm package nice-grpc-prometheus receives a total of 6,065 weekly downloads. As such, nice-grpc-prometheus popularity was classified as popular.
We found that nice-grpc-prometheus demonstrated a healthy version release cadence and project activity because the last version was released less than a year ago. It has 0 open source maintainers collaborating on the project.
Did you know?

Socket for GitHub automatically highlights issues in each pull request and monitors the health of all your open source dependencies. Discover the contents of your packages and block harmful activity before you install or update your dependencies.

Security News
Socket's package search now displays weekly downloads for npm packages, helping developers quickly assess popularity and make more informed decisions.

Security News
A Stanford study reveals 9.5% of engineers contribute almost nothing, costing tech $90B annually, with remote work fueling the rise of "ghost engineers."

Research
Security News
Socket’s threat research team has detected six malicious npm packages typosquatting popular libraries to insert SSH backdoors.