React Performance Devtool


A devtool for inspecting the performance of React Components

Table of contents
Introduction
React Performance Devtool is a browser extension for inspecting the performance of React Components. It statistically examines the performance of React components based on the measures which are collected by React using window.performance API.
Along with the browser extension, the measures can also be inspected in a console. See the usage section for more details.
This project started with a purpose of extending the work done by Will Chen on a proposal for React performance table. You can read more about it here.
Demo
Browser extension
A demo of the extension being used to examine the performance of React components on my website.

Log the measures to a console
Performance measures can also be logged to a console. With every re-render, measures are updated and logged to the console.

Uses
-
Remove or unmount the component instances which are not being used.
-
Inspect what is blocking or taking more time after an operation has been started.
-
Examine the table and see for which components, you need to write shouldComponentUpdate lifecycle hook.
-
Examine which components are taking more time to load.
Install
To use this devtool, you'll need to install a npm module which will register a listener (read more about this in usage section) and the browser extension.
Installing the extension
The below extensions represent the current stable release.
Installing the npm module
npm install react-perf-devtool
This extension and package also depends on react. Please make sure you have those installed as well.
Note - The npm module is important and required to use the devtool. So make sure you've installed it before using the browser extension.
Usage
This section of the documentation explain the usage of devtool and the API for registering an observer in a React app.
Using the browser extension
To use this devtool extension, you'll need to register an observer in your app which will observe a collection of data (performance measures) over a time.
Register observer
Registering an observer is very simple and is only one function call away. Let's see how!
const { registerObserver } = require('react-perf-devtool')

registerObserver()
You can place this code inside your index.js file (recommended) or any other file in your app.
Note - This should only be used in development mode when you need to inspect the performance of React components. Make sure to remove it when building for production.
Registering an observer hooks an object containing information about the events and performance measures of React components to the
window object, which can then be accessed inside the inspected window using eval().
With every re-render, this object is updated with new measures and events count.
The extension takes care of clearing up the memory and also the cache.
You can also pass an option object and an optional callback which receives an argument containing the parsed and aggregated measures
Using the callback
An optional callback can also be passed to registerObserver which receives parsed measures as its argument.
You can use this callback to inspect the parsed and aggregated measures, or you can integrate it with any other use case. You can also leverage these performance measures using Google Analytics by sending these measures to analytics dashboard . This process is documented here.
Example -
const { registerObserver } = require('react-perf-devtool')
function callback(measures) {
}
registerObserver({}, callback)
After you've registered the observer, start your local development server and go to http://localhost:3000/?react_perf.
The query parameter react_perf is required so that React can measure the performance timings.
Note - This extension works only for React 16 or above versions of it.
After you've installed the extension successfully, you'll see a tab called React Performance in Chrome Developer Tools.

Printing the measures to the console
The performance measures can also be logged to the console. However, the process of printing the measures is not direct. You'll need to set up a server which will listen the measures. For this, you can use micro by Zeit which is a HTTP microservice.
npm install --save micro
You can pass an option object as an argument to registerObserver to enable logging and setting up a port number.
Using the option object
{
shouldLog: boolean,
port: number
}
You can pass two properties to the option object, shouldLog and port.
-
shouldLog - It takes a boolean value. If set to true, measures will be logged to the console.
-
port - Port number for the server where the measures will be send
Example
const React = require('react')
const ReactDOM = require('react-dom')
const { registerObserver } = require('react-perf-devtool')
const Component = require('./Component')
const options = {
shouldLog: true,
port: 8080
}
function callback(measures) {
}
registerObserver(options, callback)
ReactDOM.render(<Component />, document.getElementById('root'))
const { json } = require('micro')
module.exports = async req => {
console.log(await json(req))
return 200
}
{
"main": "server.js",
"scripts": {
"start-micro": "micro -p 8080"
}
}
Schema of the measures
Below is the schema of the performance measures that are logged to the console.
{
component,
mount: {
averageTimeSpentMs,
numberOfTimes,
totalTimeSpentMs,
},
render: {
averageTimeSpentMs,
numberOfTimes,
totalTimeSpentMs,
},
update: {
averageTimeSpentMs,
numberOfTimes,
totalTimeSpentMs,
},
unmount: {
averageTimeSpentMs,
numberOfTimes,
totalTimeSpentMs,
},
totalTimeSpent,
percentTimeSpent,
numberOfInstances,
componentWillMount: {
averageTimeSpentMs,
numberOfTimes,
totalTimeSpentMs,
}
componentDidMount: {
averageTimeSpentMs,
numberOfTimes,
totalTimeSpentMs,
}
componentWillReceiveProps: {
averageTimeSpentMs,
numberOfTimes,
totalTimeSpentMs,
},
shouldComponentUpdate: {
averageTimeSpentMs,
numberOfTimes,
totalTimeSpentMs,
},
componentWillUpdate: {
averageTimeSpentMs,
numberOfTimes,
totalTimeSpentMs,
},
componentDidUpdate: {
averageTimeSpentMs,
numberOfTimes,
totalTimeSpentMs,
},
componentWillUnmount: {
averageTimeSpentMs,
numberOfTimes,
totalTimeSpentMs,
}
}
components
You can also inspect the performance of specific components using options through components property.

Example -
const options = {
shouldLog: true,
port: 3000,
components: ['App', 'Main']
}
function callback(measures) {
}
registerObserver(options, callback)
Description
Overview section

Overview section represents an overview of total time (%) taken by all the components in your application.
Results section

-
Time taken by all the components - Shows the time taken by all the components (combining all the phases).
-
Time duration for committing changes - Shows the time spent in committing changes. Read more about this here
-
Time duration for committing host effects - Shows the time spent in committing host effects i.e committing when a new tree is inserted (update) and no. of host effects (effect count in commit).
-
Time duration for calling lifecycle methods - Reports the time duration of calling lifecycle hooks and total no of methods called, when a lifecycle hook schedules a cascading update.
-
Total time
Top section

clear - The clear button clears the measures from the tables and also wipes the results.
Reload the inspected window - This button reloads the inspected window and displays the new measures.
Pending events - This indicates the pending measures (React performance data).
Components section

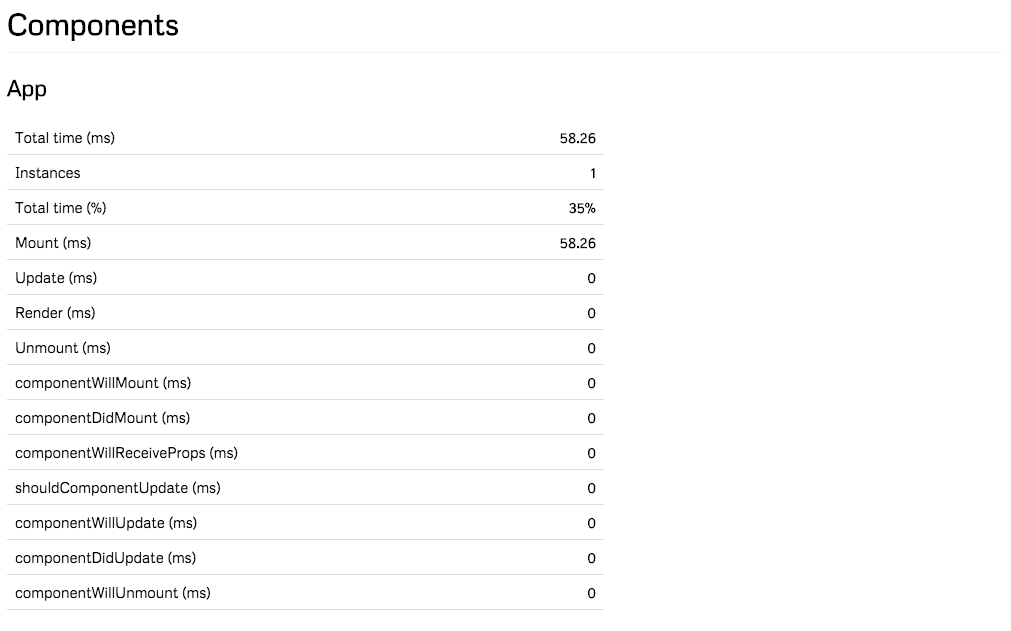
This section shows the time taken by a component in a phase, number of instances of a component and total time combining all the phases in ms and %
Phases
Given below are the different phases for which React measures the performance:
-
React Tree Reconciliation - In this phase, React renders the root node and creates a work in progress fiber. If there were some cascading updates while reconciling, it will pause any active measurements and will resumed them in a deferred loop. This is caused when a top-level update interrupts the previous render. If an error was thrown during the render phase then it captures the error by finding the nearest error boundary or it uses the root if there is no error boundary.
-
Commit changes - In this phase, the work that was completed is committed. Also, it checks whether the root node has any side-effect. If it has an effect then add it to the list (read more this list data structure here) or commit all the side-effects in the tree. If there is a scheduled update in the current commit, then it gives a warning about cascading update in lifecycle hook. During the commit phase, updates are scheduled in the current commit. Also, updates are scheduled if the phase/stage is not componentWillMount or componentWillReceiveProps.
-
Commit host effects - Host effects are committed whenever a new tree is inserted. With every new update that is scheduled, total host effects are calculated. This process is done in two phases, the first phase performs all the host node insertions, deletion, update and ref unmounts and the other phase performs all the lifecycle and ref callbacks.
-
Commit lifecycle - When the first pass was completed while committing the host effects, the work in progress tree became the current tree. So work in progress is current during componentDidMount/update. In this phase, all the lifecycles and ref callbacks are committed. Committing lifecycles happen as a separate pass so that all the placements, updates and deletions in the entire tree have already been invoked.
Implementation
In previous version of this devtool, performance metrics were being queried instead of listening for an event type. This required to comment the line inside the react-dom package (react-dom.development.js) so that these metrics can be captured by this tool.
Trade-offs
- Need to update the commonjs react-dom development bundle (commenting the line)
- No way of sending the measures from the app frame to the console
- Need to query measures rather than listening to an event once
- No control on how to inspect the measures for a particular use case (for eg - log only the render and update performance of a component)
But now, with the help of Performance Observer API, an observer can be registered to listen to an event of a particular type and get the entries (performance measures). react-perf-devtool provides an API on top of the performance observer, a function that registers an observer.
const { registerObserver } = require('react-perf-devtool')

registerObserver()
This observer listens to the React performance measurement event.
It hooks an object containing information about the events and performance measures of React components to the window object which can then be accessed inside the inspected window using eval().
With every re-render, this object is updated with new measures and events count. The extension takes care of clearing up the memory and also the cache.
An option object and an optional callback can also be passed to registerObserver. The option object is useful when performance measures are to be logged to a console. The callback receives parsed and aggregated results (metrics) as its argument which can then be used for analyses.
Benefits
Calculating and aggregating the results happens inside the app frame and not in the devtool. It has its own benefits.
- These measures can be send to a server for analyses
- Measures can be logged to a console
- Particular measures can be inspected in the console with the help of configuration object (not done with the API for it yet)
- This also gives control to the developer on how to manage and inspect the measures apart from using the extension
Todos / Ideas / Improvements
Contributing
Read the contributing guide
License
MIT


