Security News
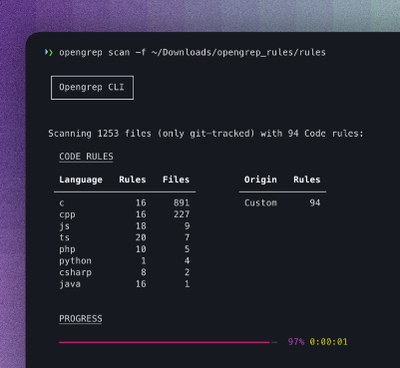
Opengrep Emerges as Open Source Alternative Amid Semgrep Licensing Controversy
Opengrep forks Semgrep to preserve open source SAST in response to controversial licensing changes.
Victory is a collection of composable React components for building interactive data visualizations. It provides a wide range of chart types and is designed to be highly customizable and easy to use.
Line Chart
Victory allows you to create line charts easily. The code sample demonstrates how to create a simple line chart using VictoryLine and VictoryChart components.
const data = [
{ x: 1, y: 2 },
{ x: 2, y: 3 },
{ x: 3, y: 5 },
{ x: 4, y: 4 },
{ x: 5, y: 7 }
];
<VictoryChart>
<VictoryLine data={data} />
</VictoryChart>Bar Chart
Victory makes it simple to create bar charts. The code sample shows how to create a bar chart using VictoryBar and VictoryChart components.
const data = [
  { x: 'A', y: 2 },
  { x: 'B', y: 3 },
  { x: 'C', y: 5 },
  { x: 'D', y: 4 },
  { x: 'E', y: 7 }
];

<VictoryChart>
  <VictoryBar data={data} />
</VictoryChart>
Pie Chart
VictoryPie component allows you to create pie charts. The code sample demonstrates how to create a pie chart with different categories.
const data = [
  { x: 'Cats', y: 35 },
  { x: 'Dogs', y: 40 },
  { x: 'Birds', y: 25 }
];

<VictoryPie data={data} />
Scatter Plot
VictoryScatter component is used to create scatter plots. The code sample shows how to create a scatter plot using VictoryScatter and VictoryChart components.
const data = [
  { x: 1, y: 2 },
  { x: 2, y: 3 },
  { x: 3, y: 5 },
  { x: 4, y: 4 },
  { x: 5, y: 7 }
];

<VictoryChart>
  <VictoryScatter data={data} />
</VictoryChart>Recharts is a Redefined chart library built with React and D3. It provides a set of composable chart components that are easy to use and highly customizable. Compared to Victory, Recharts has a more extensive set of chart types and is known for its performance and ease of integration.
Nivo provides a rich set of dataviz components, built on top of D3 and React. It offers a wide range of chart types and is highly customizable. Nivo is known for its beautiful and responsive charts, and it provides a variety of themes and styles out of the box. Compared to Victory, Nivo offers more advanced features and better aesthetics.
React wrapper for Chart.js, a popular JavaScript charting library. It provides a simple way to create charts using Chart.js in React applications. Compared to Victory, react-chartjs-2 is more lightweight and leverages the powerful Chart.js library for rendering charts.
$ npm install victory --save
import React, { Component } from "react";
import { render } from "react-dom";
import { VictoryPie } from "victory";

class PieChart extends Component {
  render() {
    return <VictoryPie />;
  }
}

render(<PieChart />, document.getElementById("app"));
VictoryPie component will be rendered, and you should see:

For detailed documentation and examples please see Victory Documentation
Projects using Victory should also depend on React and prop-types.
Want to use Victory with React Native? Check out victory-native
Victory Native shares most of its code with Victory, and has a nearly identical api!
FAQs
Data viz for React
We found that victory demonstrated a healthy version release cadence and project activity because the last version was released less than a year ago. It has 20 open source maintainers collaborating on the project.
Did you know?

Socket for GitHub automatically highlights issues in each pull request and monitors the health of all your open source dependencies. Discover the contents of your packages and block harmful activity before you install or update your dependencies.

Security News
Opengrep forks Semgrep to preserve open source SAST in response to controversial licensing changes.

Security News
Critics call the Node.js EOL CVE a misuse of the system, sparking debate over CVE standards and the growing noise in vulnerability databases.

Security News
cURL and Go security teams are publicly rejecting CVSS as flawed for assessing vulnerabilities and are calling for more accurate, context-aware approaches.