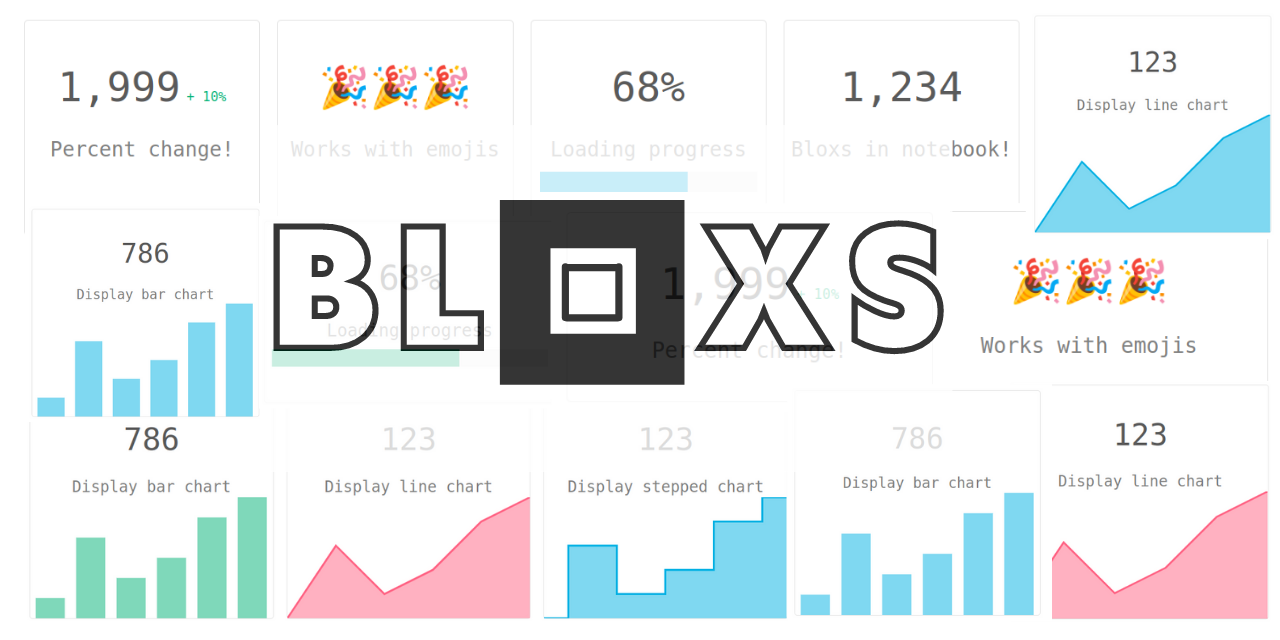
Bloxs
Bloxs is a simple python package that helps you display information in an attractive way (formed in blocks). Perfect for building dashboards, reports and apps in the notebook.
It works with: Jupyter Notebook, Google Colab, Deepnote, Kaggle Notebook, Mercury.

Get started
Install bloxs:
pip install bloxs
Import and create a bloxs:
from bloxs import B
B(1234, "Bloxs in notebook!")

Exmaples
| Bloxs | Code |
|---|
 | B(1234, "Bloxs in notebook!") |
 | B(1999, "Percent change!", percent_change=10) |
 | B("🎉🎉🎉", "Works with emojis") |
 | B("68%", "Loading progress", progress=68) |
 | B("68%", "Loading progress", progress=68, color="green") color can be "blue", "red", "green" or custom in hex format (exmaple "#fa33fa") |
 | B("123", "Display line chart", points=[1,4,2,3,5,6]) |
 | B("123", "Display line chart", points=[1,4,2,3,5,6], color="red") |
 | B("123", "Display stepped chart", points=[1,4,2,3,5,6], chart_type="stepped") |
 | B("123", "Display bar chart", points=[1,4,2,3,5,6], chart_type="bar") |
 | B("123", "Display bar chart", points=[1,4,2,3,5,6], chart_type="bar", color="green") |
You can combine several bloxs in one row:
B([
    B(1999, "Percent change!", percent_change=10),
    B("🎉🎉🎉", "Works with emojis"),
    B("68%", "Loading progress", progress=68),
    B(1234, "Bloxs in notebook!")
])

B([
    B("786", "Display bar chart", points=[1,4,2,3,5,6], chart_type="bar", color="green"),
    B("123", "Display line chart", points=[1,4,2,3,5,6], color="red"),
    B("123", "Display stepped chart", points=[1,4,2,3,5,6], chart_type="stepped")
])

:computer: You can check the notebook with above example bloxs.
Bloxs works great with Mercury
Mercury is a framework for converting notebook to an interactive web app. It adds widgets to the notebook based on the YAML config. Below is presented a notebook with bloxs and the same notebook served as a web app with Mercury.
The notebook with bloxs

The Mercury web app

The web app is available on our server :computer: