Security News
Research
Data Theft Repackaged: A Case Study in Malicious Wrapper Packages on npm
The Socket Research Team breaks down a malicious wrapper package that uses obfuscation to harvest credentials and exfiltrate sensitive data.
Each of the files found in this directory are a JSON file that contains all of the information related to a Kibana dashboard. This usually has information about the following artifacts:
There are Dashboards for Kibana 6 right now stored in panels/json
A panel is composed by the several widgets this contains. So far the panels proposed as generic are a mix of the several data sources available in a project. Those could be only focused on Git, but there are others such as review systems like Gerrit, IRC channels, mailing lists, etc.
The structure for naming files should be:
<data_source>[_<panel_name>].json

Examples:
git_<panel_name>.json
gerrit_<panel_name>.json
<panel_name>.json

Examples:
about.json
overview.json
git.json
git_pair_programming.json
gerrit.json
gerrit_timing.json
To give some examples, below there is a list of some panels that can be found in this directory:
All panels will provide widgets for filtering information by project, domain, organization, etc. depending on the availability of that information in the corresponding index.
 <data_source>_<metric_used>

 Example: git_top_authors
 Example: git_authors
Where data source could be git, gerrit, mbox, etc.
In general, titles should follow the same naming scheme as the widget itself, substituting underscore characters by single spaces and adding capital letters. Nevertheless, widgets title depends on the name of the panel in which the widgets are located:
If the panel shows information for several data sources, then the name of the data source must be included. For example, it's the case of Data Status Panel, because it contains the same information per data source, so using data source name in title is mandatory.
If the name of the data source is included in the title of the panel, then the name of the data source shouldn't be included in widgets' title, except in cases where it could help understand what the widget contains.
 <data_source> <metric_used>

 Example:
   Same visualization for top authors would be named:

   - 'Top Authors' in 'Git' panel, as the panel is giving us context.
   - 'Git Top Authors' in 'Overview' panel where we could have similar visualizations for other data sources.
Of course this is a general rule, just have context into account with naming widgets to know if data source is clear or not.
Search:_<field>:<search>

Example: Search:_pull_request:true
Notice that optional date is included to allow keeping several copies of the same data source when needed.
Raw indexes should use suffix -raw:
<data_source>-raw[_date]

Example: git-raw
Example: gerrit-raw
Example: stackoverflow-raw
Example: jira-raw
Example: bugzilla-raw
Enriched indexes:
<data_source>_enriched[_date]

Example: git_enriched
Example: gerrit_enriched
Example: stackoverflow_enriched
Example: jira_enriched
Example: bugzilla_enriched
Finally, an alias should be created pointing to the enriched index. This allows to easily modify the data used under the hood in a transparent way from the point of view of panels. Its name should be just the name of the data source, but sometimes we need different indexes for the same data source. In that case we would add a suffix to indicate the functionality of that alias.
<data_source>

Example: git
Example: gerrit
Example: stackoverflow
Example: jira
Example: bugzilla
For each index there could be as many aliases as needed. The most usual use case is using aliases for building panels or visualizations based on different time series. E.g.:
<data_source>_<field_name>

Example for git index and metadata__timestamp:
git_metadata__timestamp

Example for git index and metadata__updated_on:
git_metadata__updated_on

Example for jenkins and created_at field:
jenkins_created_at
Index patterns in Kibana should follow the same naming scheme as aliases in ES (see Aliases Naming section). This way, is easy to know what alias is being used by a given index pattern. Besides, it makes easier to select index patterns from kibana, because their names include the field configured for time series in that index pattern.
Following fields that should be included in any index pattern:
Each of the indexes are based on a previous definition. This is declared in CSV format with two columns: name and type.
More information at the Schema directory.
These json files were retrieved using Kidash.
Example of how to run this:
$ kidash -g -e <elasticsearch-url> --dashboard <dashboard-id>* --export <local-file-path> --split-index-patterns

example:
$ kidash -g -e https://admin:admin@localhost:9200 --dashboard overview --export overview.json --split-index-patterns
More information: Kidash - Usage.
FAQs
Panels and visualizations for GrimoireLab dashboards
We found that grimoirelab-panels demonstrated a healthy version release cadence and project activity because the last version was released less than a year ago. It has 2 open source maintainers collaborating on the project.
Did you know?

Socket for GitHub automatically highlights issues in each pull request and monitors the health of all your open source dependencies. Discover the contents of your packages and block harmful activity before you install or update your dependencies.

Security News
Research
The Socket Research Team breaks down a malicious wrapper package that uses obfuscation to harvest credentials and exfiltrate sensitive data.

Research
Security News
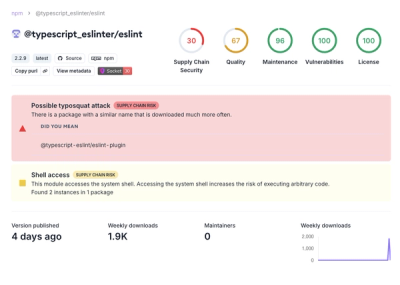
Attackers used a malicious npm package typosquatting a popular ESLint plugin to steal sensitive data, execute commands, and exploit developer systems.

Security News
The Ultralytics' PyPI Package was compromised four times in one weekend through GitHub Actions cache poisoning and failure to rotate previously compromised API tokens.