Research
/Security News
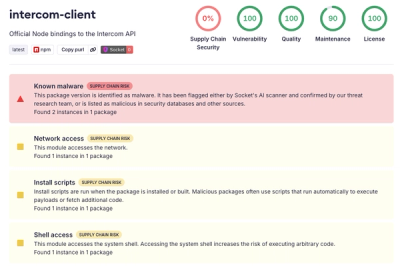
Intercom’s npm Package Compromised in Ongoing Mini Shai-Hulud Worm Attack
Compromised intercom-client@7.0.4 npm package is tied to the ongoing Mini Shai-Hulud worm attack targeting developer and CI/CD secrets.
By Socket Research Team - Apr 30, 2026