Security News
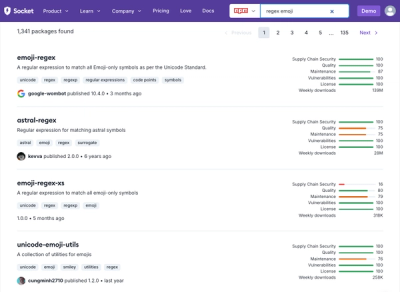
Weekly Downloads Now Available in npm Package Search Results
Socket's package search now displays weekly downloads for npm packages, helping developers quickly assess popularity and make more informed decisions.
OpenTracing handler for the Python logging library
Information: This library is currently in a beta state
Install the package with pip
pip install logging-opentracing
We use the mock tracer for the follwing examples but you can also use other OpenTracing compatible tracers.
An compatible tracer would be, for instance, Jaeger
In the first example we initialize the OpenTracingHandler for logging and create an active span with the name
hello-world.
In this active span we make make an info-log and in the end we have a look if this log was forwarded to OpenTracing.
import logging

from opentracing.mocktracer import MockTracer

from logging_opentracing import OpenTracingHandler

# initialize a mock tracer
tracer = MockTracer()

# prepare the logger
logger = logging.getLogger('mylogger')
logger.setLevel(logging.INFO)

# create a new OpenTracing handler for the logging package
handler = OpenTracingHandler(tracer=tracer)
logger.addHandler(handler)

# start an active span
with tracer.start_active_span('hello-world'):
    # this log will be propagated to
    logger.info('Hello World from Python logging to OpenTracing')

# retrieve the finished span
finished_span = tracer.finished_spans()[0]
# get the log line from
log = finished_span.logs[0]

# print the key_values of the log
print(log.key_values)
# {'event': 'info', 'message': 'Hello World from Python logging to OpenTracing'}
Here some additional explanation
# initialize a mock tracer
tracer = MockTracer()
Initialize the mock tracer from the OpenTracing library. As mentioned before, instead you can use any OpenTracing compatible tracer.
# prepare the logger
logger = logging.getLogger('mylogger')
logger.setLevel(logging.INFO)
Prepare a logger from the Python logging package.
Set its logging level to INFO such that logs with the severity INFO are also captured.
# create a new OpenTracing handler for the logging package
handler = OpenTracingHandler(tracer=tracer)
logger.addHandler(handler)
First, initialize the OpenTracing handler OpenTracingHandler for logging.
It needs an OpenTracing tracer as parameter.
Then, add the handler to the logger.
# start an active span
with tracer.start_active_span('hello-world'):
    # this log will be propagated to
    logger.info('Hello World from Python logging to OpenTracing')
Start a new active span with the name hello-world.
Within this active span, make a log with the severity info.
It is expected that this log will be captured by our handler for OpenTracing which should forward the log to our tracer.
# retrieve the finished span
finished_span = tracer.finished_spans()[0]
# get the log line from
log = finished_span.logs[0]

# print the key_values of the log
print(log.key_values)
# {'event': 'info', 'message': 'Hello World from Python logging to OpenTracing'}
These lines are only used to check if the log has been successfully forwarder to out tracer.
The previous example showed how logs are forwarded to OpenTracing with the default formating option for logs.
Thereby, the defalt format is {'info': <log severity>, 'message': <log format>}.
In the case that a different formatting is required, in the constructor of OpenTracingHandler can be adjusted.
To do so, set the parameter kv_format.
It expects a dictionary, where each key-value pair represents a key value pair forwarded to the method log_kv() of
OpenTracing. Thereby,
key is the key which will be directly used as key in the OpenTracing logvalue is a string which can contain placeholders for %-stype formatting of the logging package. (See also Format for more details)For each key-value pair a new formatter logging.Formatter will be created.
When we replace from the previous simple example the lines
# create a new OpenTracing handler for the logging package
handler = OpenTracingHandler(tracer=tracer)
with the following lines
# create a new formatter with a custom format
formatter = OpenTracingFormatter(kv_format={
    'event': '%(levelname_lower)s',
    'message': '%(message)s',
    'source': '%(filename)s:L%(lineno)d',
})

# create a new OpenTracing handler which uses the custom formatter
handler = OpenTracingHandler(tracer=tracer, formatter=formatter)
we initialize a handler with a formatter with a custom format.
The expected output of the modified example is
{'event': 'info', 'message': 'Hello World from Python logging to OpenTracing', 'source': 'custom_formatter.py:L26'}
See the full example custom_formatter.py
The OpenTracing logging handler tries to retrieve a span by accessing the current scope
scope = tracer.scope_manager.active and an the case that a scope is available accessing its current span
span = scope.span.
However, such a scope is only available when a scope has been indirectly created through starting an active span
tracer.start_active_span() or when a scope has been directly activated tracer.scope_manager.activate().
Therefore it is also possible to pass a span to a log with the extra parameter.
# start a span
with tracer.start_span('hello-world') as span:
    # the span is directly passed to the log with the "extra" parameter
    logger.info('A span has been directly passed', extra={'span': span})
The default key which is used to check if a span has been passed is 'span'.
However, it can be customized in the instantiation of the handler.
handler = OpenTracingHandler(tracer=tracer, span_key='sp')

# ...

# start a span
with tracer.start_span('hello-world') as span:
    # the span is directly passed to the log with the "extra" parameter
    # this time we have to use the key "sp" because we set span_key='sp' in the constructor
    logger.info('A span has been directly passed', extra={'sp': span})
See the full example span_passed.py
The OpenTracing handler can also be used to log exceptions.
To do so, just log with the the level exception.
try:
    logger.info('This will be difficult')
    # this statement will cause a ZeroDivisionError
    1 / 0
except ZeroDivisionError:
    logger.exception('Oh no we have a ZeroDivision Error')
This would result in the logs
{'event': 'info', 'message': 'This will be difficult'}
{'event': 'error', 'message': 'Oh no we have a ZeroDivision Error', 'error.object': ZeroDivisionError('division by zero'), 'error.kind': <class 'ZeroDivisionError'>, 'stack': '  File \"<path_suffix>/logging_opentracing/examples/exception.py\" line 23, in <module>\\n    1 / 0\\n'}
where the same formatting is used like OpenTracing uses when an uncaught exception is created.
See the full example exception.py
To each logging call extra key-value pairs can be passed which should be included in a OpenTracing log.
Pass a dictionary with the key-value pairs to be added to the key kv of the extra parameter of a logging call.
# add additional key-value pairs to the log by providing a dict to the key "kv" of the "extra" parameter
logger.info('Here we pass additional arguments to the log', extra={'kv': {'key a': [1, 2, 3], 'key b': 'foo'}})
which results in a log
{'event': 'info', 'message': 'Here we pass additional arguments to the log', 'key a': [1, 2, 3], 'key b': 'foo'}
Per default these additional key-value pairs are expected to have the key kv.
However, this can be customized by setting the parameter extra_kv_key of the constructor of OpenTracingHandler.
OpenTracingHandler(tracer=tracer, extra_kv_key='properties')

# ...

# add additional key-value pairs to the log by providing a dict to the customized key "properties" of the "extra" parameter
logger.info('Here we pass additional arguments to the log', extra={'properties': {'key a': [1, 2, 3], 'key b': 'foo'}})
See the full example extra_kv.py
This library uses logging.Formatter(fmt=fmt).format(logging_LogRecord) for getting information from a
logging.LogRecord, where fmt is the format specified in the
values of the parameter kv_format in the constructor of OpenTracingHandler.
logging_LogRecord is the variable which hold a logging.logRecord.
Therefore, the format of fmt follows the formatting specification of
LogRecord attributes.
Following, an excerpt of the official Python docs; use the format placeholders specified in the column Format.
| Attribute name | Format | Description |
|---|---|---|
| asctime | %(asctime)s | Human-readable time when the LogRecord was created. By default this is of the form ‘2003-07-08 16:49:45,896’ (the numbers after the comma are millisecond portion of the time). |
| created | %(created)f | Time when the LogRecord was created (as returned by time.time()). |
| filename | %(filename)s | Filename portion of pathname. |
| funcName | %(funcName)s | Name of function containing the logging call. |
| levelname | %(levelname)s | Text logging level for the message ('DEBUG', 'INFO', 'WARNING', 'ERROR', 'CRITICAL'). |
| levelname_lower | %(levelname_lower)s | Lower case text logging level for the message ('debug', 'info', 'warning', 'error', 'critical'). This is a non-default attribute which will be automatically added by the OpenTracingFormatter. |
| levelno | %(levelno)s | Numeric logging level for the message (DEBUG, INFO, WARNING, ERROR, CRITICAL). |
| lineno | %(lineno)d | Source line number where the logging call was issued (if available). |
| message | %(message)s | The logged message. This is set when Formatter.format() is invoked. |
| module | %(module)s | Module (name portion of filename). |
| msecs | %(msecs)d | Millisecond portion of the time when the LogRecord was created. |
| name | %(name)s | Name of the logger used to log the call. |
| pathname | %(pathname)s | Full pathname of the source file where the logging call was issued (if available). |
| process | %(process)d | Process ID (if available). |
| processName | %(processName)s | Process name (if available). |
| relativeCreated | %(relativeCreated)d | Time in milliseconds when the LogRecord was created, relative to the time the logging module was loaded. |
| thread | %(thread)d | Thread ID (if available). |
| threadName | %(threadName)s | Thread name (if available). |
FAQs
OpenTracing handler for the Python logging library
We found that logging-opentracing demonstrated a healthy version release cadence and project activity because the last version was released less than a year ago. It has 1 open source maintainer collaborating on the project.
Did you know?

Socket for GitHub automatically highlights issues in each pull request and monitors the health of all your open source dependencies. Discover the contents of your packages and block harmful activity before you install or update your dependencies.

Security News
Socket's package search now displays weekly downloads for npm packages, helping developers quickly assess popularity and make more informed decisions.

Security News
A Stanford study reveals 9.5% of engineers contribute almost nothing, costing tech $90B annually, with remote work fueling the rise of "ghost engineers."

Research
Security News
Socket’s threat research team has detected six malicious npm packages typosquatting popular libraries to insert SSH backdoors.