Security News
Research
Data Theft Repackaged: A Case Study in Malicious Wrapper Packages on npm
The Socket Research Team breaks down a malicious wrapper package that uses obfuscation to harvest credentials and exfiltrate sensitive data.
The QGate Performance is enabler for python performance test execution. Key benefits:
NOTE: The recommendations are:
from qgate_perf.parallel_executor import ParallelExecutor
from qgate_perf.parallel_probe import ParallelProbe
from qgate_perf.run_setup import RunSetup
import time
def prf_GIL_impact(run_setup: RunSetup):
""" Your own function for performance testing, you have to add
only part INIT, START, STOP and RETURN"""
# INIT - contain executor synchronization, if needed
probe=ParallelProbe(run_setup)
while (True):
# START - probe, only for this specific code part
probe.start()
for r in range(run_setup.bulk_row * run_setup.bulk_col):
time.sleep(0)
# STOP - probe
if probe.stop():
break
# RETURN - data from probe
return probe
# Execution setting
generator = ParallelExecutor(prf_GIL_impact,
label="GIL_impact",
detail_output=True,
output_file="prf_gil_impact_01.txt")
# Run setup, with test execution 20 seconds and zero delay before start
# (without waiting to other executors)
setup=RunSetup(duration_second=20,start_delay=0)
# Run performance test with:
# data bulk_list with two data sets
# - first has 10 rows and 5 columns as [10, 5]
# - second has 1000 rows and 50 columns as [1000, 50]
# executor_list with six executor sets
# - first line has three executors with 2, 4 and 8 processes each with 2 threads
# - second line has three executors with 2, 4 and 8 processes each with 4 threads
generator.run_bulk_executor(bulk_list=[[10, 5], [1000, 50]],
executor_list=[[2, 2, '2x thread'], [4, 2, '2x thread'],[8, 2,'2x thread'],
[2, 4, '4x thread'], [4, 4, '4x thread'],[8, 4,'4x thread']],
run_setup=setup)
# Note: We made 12 performance tests (two bulk_list x six executor_list) and write
# outputs to the file 'prf_gil_impact_01.txt'
# We generate performance graph based on performance tests to the
# directory './output/graph-perf/*' (two files each for different bundle)
generator.create_graph_perf()
############### 2023-05-05 06:30:36.194849 ###############
{"type": "headr", "label": "GIL_impact", "bulk": [1, 1], "available_cpu": 12, "now": "2023-05-05 06:30:36.194849"}
  {"type": "core", "plan_executors": 4, "plan_executors_detail": [4, 1], "real_executors": 4, "group": "1x thread", "total_calls": 7590439, "avrg_time": 1.4127372338382197e-06, "std_deviation": 3.699171006877347e-05, "total_call_per_sec": 2831382.8673804617, "endexec": "2023-05-05 06:30:44.544829"}
  {"type": "core", "plan_executors": 8, "plan_executors_detail": [8, 1], "real_executors": 8, "group": "1x thread", "total_calls": 11081697, "avrg_time": 1.789265660825848e-06, "std_deviation": 4.164309967620533e-05, "total_call_per_sec": 4471107.994274894, "endexec": "2023-05-05 06:30:52.623666"}
  {"type": "core", "plan_executors": 16, "plan_executors_detail": [16, 1], "real_executors": 16, "group": "1x thread", "total_calls": 8677305, "avrg_time": 6.2560950624827455e-06, "std_deviation": 8.629422798757681e-05, "total_call_per_sec": 2557505.8946835063, "endexec": "2023-05-05 06:31:02.875799"}
  {"type": "core", "plan_executors": 8, "plan_executors_detail": [4, 2], "real_executors": 8, "group": "2x threads", "total_calls": 2761851, "avrg_time": 1.1906723084757647e-05, "std_deviation": 0.00010741937495211329, "total_call_per_sec": 671889.3135459893, "endexec": "2023-05-05 06:31:10.283786"}
  {"type": "core", "plan_executors": 16, "plan_executors_detail": [8, 2], "real_executors": 16, "group": "2x threads", "total_calls": 3605920, "avrg_time": 1.858694254439209e-05, "std_deviation": 0.00013301637613377212, "total_call_per_sec": 860819.3607844017, "endexec": "2023-05-05 06:31:18.740831"}
  {"type": "core", "plan_executors": 16, "plan_executors_detail": [4, 4], "real_executors": 16, "group": "4x threads", "total_calls": 1647508, "avrg_time": 4.475957498576462e-05, "std_deviation": 0.00020608402170105327, "total_call_per_sec": 357465.41393855185, "endexec": "2023-05-05 06:31:26.008649"}
############### Duration: 49.9 seconds ###############
############### 2023-05-05 07:01:18.571700 ###############
{"type": "headr", "label": "GIL_impact", "bulk": [1, 1], "available_cpu": 12, "now": "2023-05-05 07:01:18.571700"}
     {"type": "detail", "processid": 12252, "calls": 1896412, "total": 2.6009109020233154, "avrg": 1.371490426143325e-06, "min": 0.0, "max": 0.0012514591217041016, "st-dev": 3.6488665183545995e-05, "initexec": "2023-05-05 07:01:21.370528", "startexec": "2023-05-05 07:01:21.370528", "endexec": "2023-05-05 07:01:26.371062"}
     {"type": "detail", "processid": 8944, "calls": 1855611, "total": 2.5979537963867188, "avrg": 1.4000530264084008e-06, "min": 0.0, "max": 0.001207590103149414, "st-dev": 3.6889275786419565e-05, "initexec": "2023-05-05 07:01:21.466496", "startexec": "2023-05-05 07:01:21.466496", "endexec": "2023-05-05 07:01:26.466551"}
     {"type": "detail", "processid": 2108, "calls": 1943549, "total": 2.6283881664276123, "avrg": 1.3523652691172758e-06, "min": 0.0, "max": 0.0012514591217041016, "st-dev": 3.624462003401045e-05, "initexec": "2023-05-05 07:01:21.709203", "startexec": "2023-05-05 07:01:21.709203", "endexec": "2023-05-05 07:01:26.709298"}
     {"type": "detail", "processid": 19292, "calls": 1973664, "total": 2.6392557621002197, "avrg": 1.3372366127670262e-06, "min": 0.0, "max": 0.0041027069091796875, "st-dev": 3.620965943471147e-05, "initexec": "2023-05-05 07:01:21.840541", "startexec": "2023-05-05 07:01:21.840541", "endexec": "2023-05-05 07:01:26.841266"}
  {"type": "core", "plan_executors": 4, "plan_executors_detail": [4, 1], "real_executors": 4, "group": "1x thread", "total_calls": 7669236, "avrg_time": 1.3652863336090071e-06, "std_deviation": 3.645805510967187e-05, "total_call_per_sec": 2929788.3539391863, "endexec": "2023-05-05 07:01:26.891144"}
  ...
The performance graph with 512 executors (128 processes x 4 threads). You can see performance visualisation:
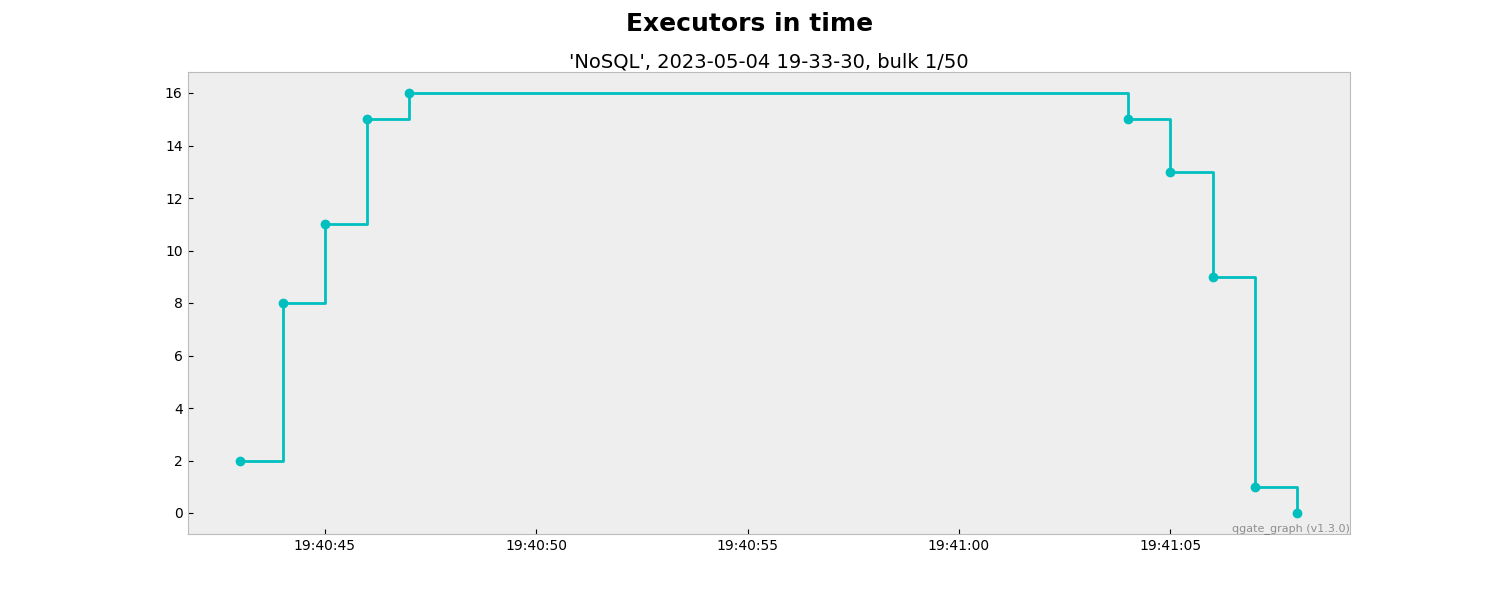
 The executor graph, you can see amount of executors in time.


FAQs
Performance test generator, part of Quality Gate
We found that qgate-perf demonstrated a healthy version release cadence and project activity because the last version was released less than a year ago. It has 1 open source maintainer collaborating on the project.
Did you know?

Socket for GitHub automatically highlights issues in each pull request and monitors the health of all your open source dependencies. Discover the contents of your packages and block harmful activity before you install or update your dependencies.

Security News
Research
The Socket Research Team breaks down a malicious wrapper package that uses obfuscation to harvest credentials and exfiltrate sensitive data.

Research
Security News
Attackers used a malicious npm package typosquatting a popular ESLint plugin to steal sensitive data, execute commands, and exploit developer systems.

Security News
The Ultralytics' PyPI Package was compromised four times in one weekend through GitHub Actions cache poisoning and failure to rotate previously compromised API tokens.