QGate-Perf
The QGate Performance is enabler for python performance test execution. Key benefits:
- easy performance testing your python code (key parts - init, start, stop, return)
- measure only specific part of your code
- scalability without limits (e.g. from 1 to 1k executors)
- scalability in level of processes and threads (easy way, how to avoid GIL in python)
- sequences for execution and data bulk
- relation to graph generator
NOTE: The recommendations are:
- use Python >= 3.11
- use the 'QGate-Perf-cs' (C# implementation of QGate-Perf), in case of bigger parallelism and lower CPU spending
Usage
from qgate_perf.parallel_executor import ParallelExecutor
from qgate_perf.parallel_probe import ParallelProbe
from qgate_perf.run_setup import RunSetup
import time
def prf_GIL_impact(run_setup: RunSetup):
""" Your own function for performance testing, you have to add
only part INIT, START, STOP and RETURN"""
probe=ParallelProbe(run_setup)
while (True):
probe.start()
for r in range(run_setup.bulk_row * run_setup.bulk_col):
time.sleep(0)
if probe.stop():
break
return probe
generator = ParallelExecutor(prf_GIL_impact,
label="GIL_impact",
detail_output=True,
output_file="prf_gil_impact_01.txt")
setup=RunSetup(duration_second=20,start_delay=0)
generator.run_bulk_executor(bulk_list=[[10, 5], [1000, 50]],
executor_list=[[2, 2, '2x thread'], [4, 2, '2x thread'],[8, 2,'2x thread'],
[2, 4, '4x thread'], [4, 4, '4x thread'],[8, 4,'4x thread']],
run_setup=setup)
generator.create_graph_perf()
Outputs in text file
############### 2023-05-05 06:30:36.194849 ###############
{"type": "headr", "label": "GIL_impact", "bulk": [1, 1], "available_cpu": 12, "now": "2023-05-05 06:30:36.194849"}
  {"type": "core", "plan_executors": 4, "plan_executors_detail": [4, 1], "real_executors": 4, "group": "1x thread", "total_calls": 7590439, "avrg_time": 1.4127372338382197e-06, "std_deviation": 3.699171006877347e-05, "total_call_per_sec": 2831382.8673804617, "endexec": "2023-05-05 06:30:44.544829"}
  {"type": "core", "plan_executors": 8, "plan_executors_detail": [8, 1], "real_executors": 8, "group": "1x thread", "total_calls": 11081697, "avrg_time": 1.789265660825848e-06, "std_deviation": 4.164309967620533e-05, "total_call_per_sec": 4471107.994274894, "endexec": "2023-05-05 06:30:52.623666"}
  {"type": "core", "plan_executors": 16, "plan_executors_detail": [16, 1], "real_executors": 16, "group": "1x thread", "total_calls": 8677305, "avrg_time": 6.2560950624827455e-06, "std_deviation": 8.629422798757681e-05, "total_call_per_sec": 2557505.8946835063, "endexec": "2023-05-05 06:31:02.875799"}
  {"type": "core", "plan_executors": 8, "plan_executors_detail": [4, 2], "real_executors": 8, "group": "2x threads", "total_calls": 2761851, "avrg_time": 1.1906723084757647e-05, "std_deviation": 0.00010741937495211329, "total_call_per_sec": 671889.3135459893, "endexec": "2023-05-05 06:31:10.283786"}
  {"type": "core", "plan_executors": 16, "plan_executors_detail": [8, 2], "real_executors": 16, "group": "2x threads", "total_calls": 3605920, "avrg_time": 1.858694254439209e-05, "std_deviation": 0.00013301637613377212, "total_call_per_sec": 860819.3607844017, "endexec": "2023-05-05 06:31:18.740831"}
  {"type": "core", "plan_executors": 16, "plan_executors_detail": [4, 4], "real_executors": 16, "group": "4x threads", "total_calls": 1647508, "avrg_time": 4.475957498576462e-05, "std_deviation": 0.00020608402170105327, "total_call_per_sec": 357465.41393855185, "endexec": "2023-05-05 06:31:26.008649"}
############### Duration: 49.9 seconds ###############
Outputs in text file with detail
############### 2023-05-05 07:01:18.571700 ###############
{"type": "headr", "label": "GIL_impact", "bulk": [1, 1], "available_cpu": 12, "now": "2023-05-05 07:01:18.571700"}
     {"type": "detail", "processid": 12252, "calls": 1896412, "total": 2.6009109020233154, "avrg": 1.371490426143325e-06, "min": 0.0, "max": 0.0012514591217041016, "st-dev": 3.6488665183545995e-05, "initexec": "2023-05-05 07:01:21.370528", "startexec": "2023-05-05 07:01:21.370528", "endexec": "2023-05-05 07:01:26.371062"}
     {"type": "detail", "processid": 8944, "calls": 1855611, "total": 2.5979537963867188, "avrg": 1.4000530264084008e-06, "min": 0.0, "max": 0.001207590103149414, "st-dev": 3.6889275786419565e-05, "initexec": "2023-05-05 07:01:21.466496", "startexec": "2023-05-05 07:01:21.466496", "endexec": "2023-05-05 07:01:26.466551"}
     {"type": "detail", "processid": 2108, "calls": 1943549, "total": 2.6283881664276123, "avrg": 1.3523652691172758e-06, "min": 0.0, "max": 0.0012514591217041016, "st-dev": 3.624462003401045e-05, "initexec": "2023-05-05 07:01:21.709203", "startexec": "2023-05-05 07:01:21.709203", "endexec": "2023-05-05 07:01:26.709298"}
     {"type": "detail", "processid": 19292, "calls": 1973664, "total": 2.6392557621002197, "avrg": 1.3372366127670262e-06, "min": 0.0, "max": 0.0041027069091796875, "st-dev": 3.620965943471147e-05, "initexec": "2023-05-05 07:01:21.840541", "startexec": "2023-05-05 07:01:21.840541", "endexec": "2023-05-05 07:01:26.841266"}
  {"type": "core", "plan_executors": 4, "plan_executors_detail": [4, 1], "real_executors": 4, "group": "1x thread", "total_calls": 7669236, "avrg_time": 1.3652863336090071e-06, "std_deviation": 3.645805510967187e-05, "total_call_per_sec": 2929788.3539391863, "endexec": "2023-05-05 07:01:26.891144"}
  ...
Graphs generated from qgate-graph based on outputs from qgate-perf
The performance graph with 512 executors (128 processes x 4 threads).
You can see performance visualisation:
- calls per second for different amount of executors
- response time in seconds with standard deviation for different amount of executors
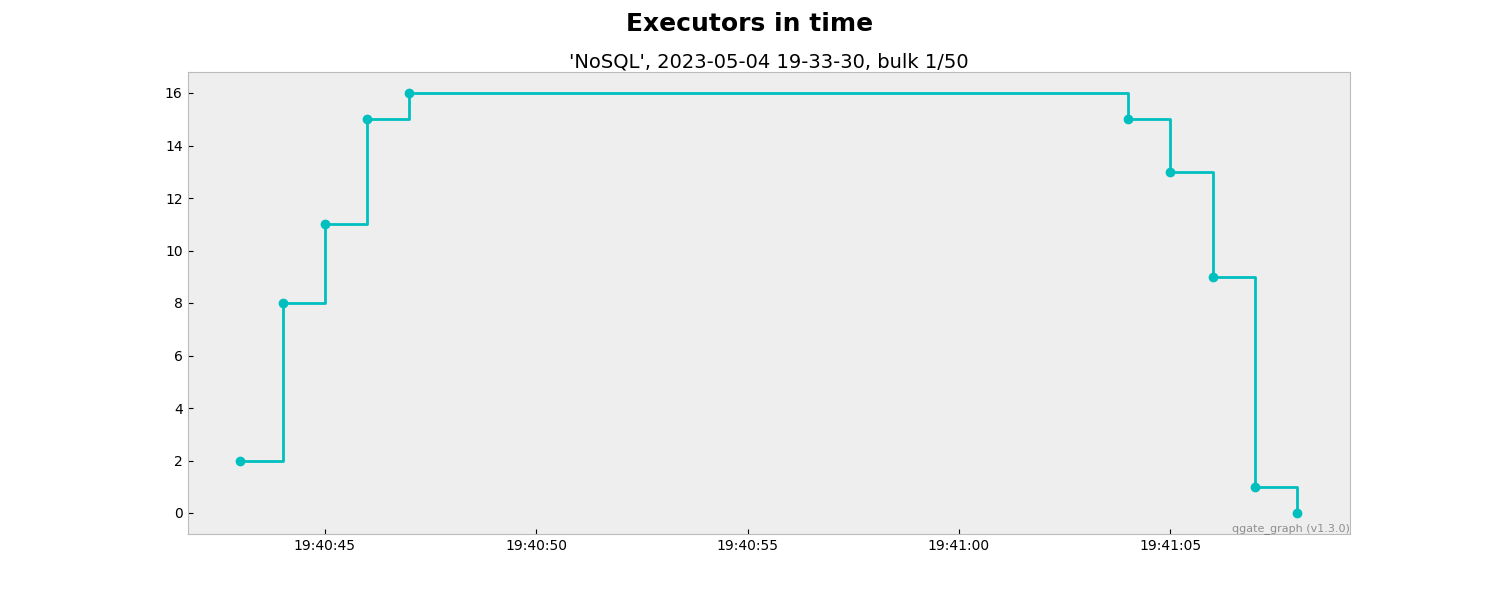
 The executor graph, you can see amount of executors in time.

32 executors (8 processes x 4 threads)