| 


 |
| 


 )
)


RADIS is a fast line-by-line code for high resolution infrared molecular
spectra (emission / absorption, equilibrium / non-LTE) based on
HITRAN/HITEMP/ExoMol.
It includes post-processing tools to compare experimental spectra and
spectra calculated with RADIS or other spectral codes.
User full documentation (advanced install and examples) are available on
the RADIS Website.
Getting Started
Install
Assuming you have Python installed with the
Anaconda distribution you can use
pip:
pip install radis
or mamba or conda via the conda-forge channel:
conda install radis -c conda-forge
That's it! You can now run your first example below. If you
encounter any issue, or to upgrade the package later, please refer to
the detailed installation
procedure
.
Quick Start
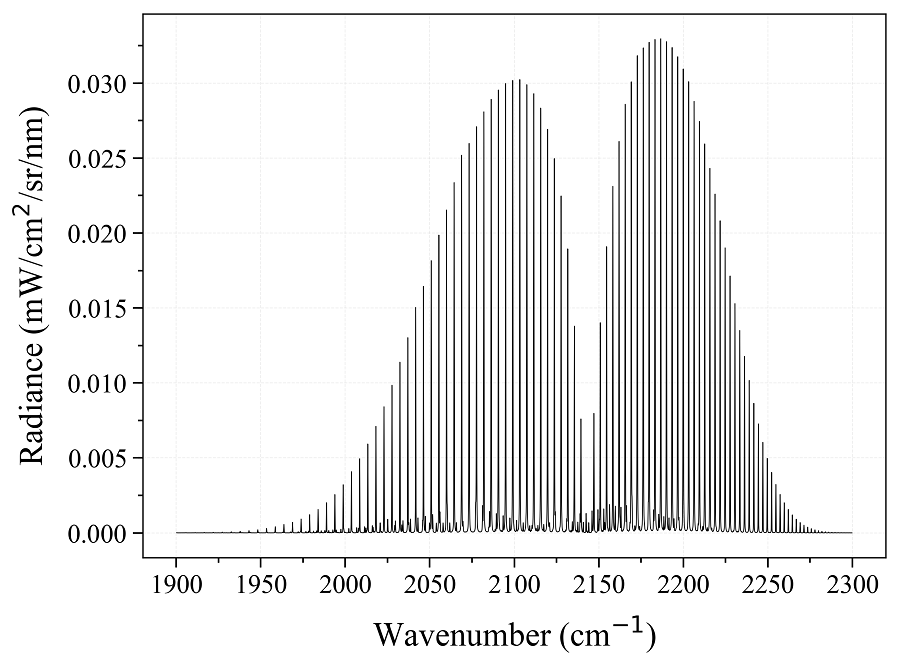
Calculate a CO equilibrium spectrum from the HITRAN database :
from radis import calc_spectrum
s = calc_spectrum(1900, 2300,         # cm-1
                  molecule='CO',
                  isotope='1,2,3',
                  pressure=1.01325,   # bar
                  Tgas=700,           # K
                  mole_fraction=0.1,
                  path_length=1,      # cm
                  databank='hitran'   # or 'hitemp'
                  )
s.apply_slit(0.5, 'nm')       # simulate an experimental slit
s.plot('radiance')
Advanced use
The Quick Start examples automatically downloads the line databases from
HITRAN-2016,
which is valid for temperatures below 700 K. For high temperature
cases, you may need to use other line databases such as
HITEMP-2010
(typically T < 2000 K) or
CDSD-4000
(T < 5000 K). HITEMP can also be downloaded automatically, or can be
downloaded manually and described in a ~/radis.json Configuration
file.
More complex
examples
will require to use the
SpectrumFactory
class, which is the core of RADIS line-by-line calculations.
calc_spectrum
is a wrapper to
SpectrumFactory
for the simple cases.
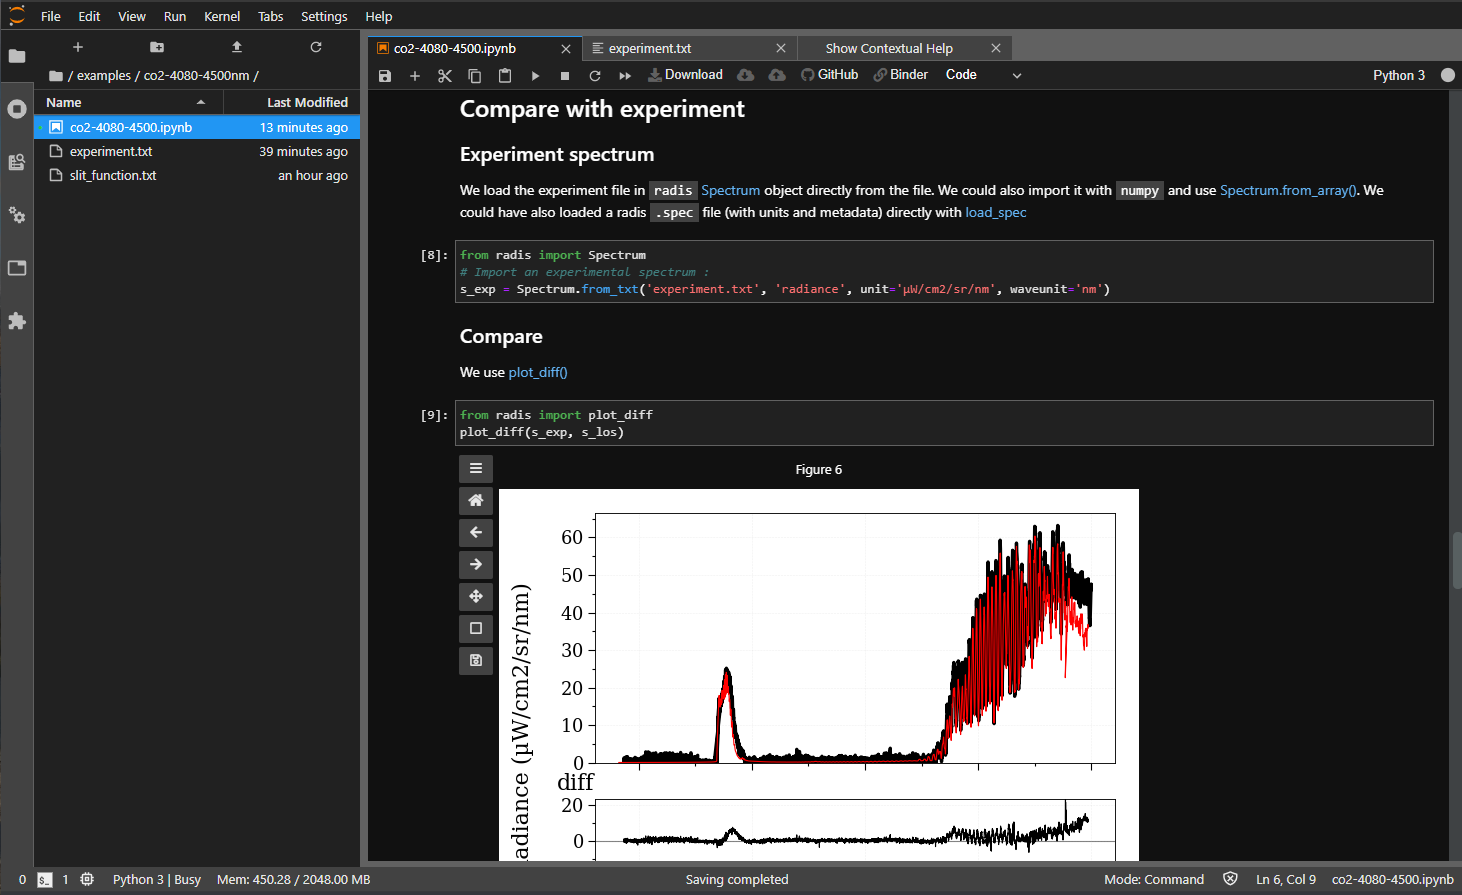
Compare with experiments
Experimental spectra can be loaded using the
experimental_spectrum
function and compared with the
plot_diff
function. For instance:
from numpy import loadtxt
from radis import experimental_spectrum, plot_diff
w, I = loadtxt('my_file.txt').T    # assuming 2 columns
sexp = experimental_spectrum(w, I, Iunit='mW/cm2/sr/nm')
plot_diff(sexp, s)    # comparing with spectrum 's' calculated previously
Typical output of
plot_diff:

Refer to the
Examples
section for more examples, and to the Spectrum
page for
more post-processing functions.
GPU Acceleration
RADIS supports GPU acceleration for super-fast computation of spectra.
Refer to GPU Spectrum Calculation on
RADIS
for more details on GPU acceleration.:
=======================================
Try online (no installation needed!)
🌱 Radis-app ---------
A simple web-app for RADIS under development -
GitHub

🔬 RADIS-lab ---------
An online environment for advanced
spectrum processing and comparison with experimental data:
- no need to install anything
- use pre-configured line databases (HITEMP)
- upload your data files, download your results !
See more on GitHub
Cite
Articles are available at
For reproducibility, do not forget to cite the line database used, and
the spectroscopic constants if running nonequilibrium calculations. See
How to
cite?
Developer Guide
Contribute
Want to contribute to RADIS? Join the Slack community and we'll help
you through the process. Want to get started immediatly? Nice. Have a
look at the the Developer
Guide.
RADIS internals are also described in the full
documentation
License
The code is available on this repository under GNU LESSER GENERAL
PUBLIC LICENSE (v3)
References
Links
- Documentation:
- Help:
 Q&A forum
 - Articles:
- Source Code:

- Test Status:
- PyPi Repository:
- Interactive Examples:
radis_examples

- Fitroom (for advanced
multidimensional fitting).
Other Spectroscopic tools
See awesome-spectra


