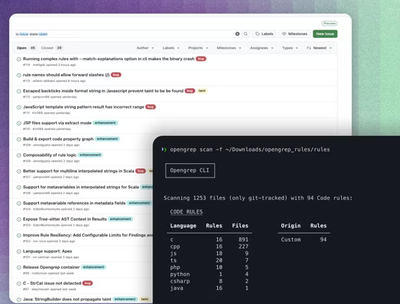
New Case Study:See how Anthropic automated 95% of dependency reviews with Socket.Learn More

charted

Advanced tools

Socket logo

Install Socket

Detect and block malicious and high-risk dependencies

Install

charted

Charts an entire collection of data. Single or multiple y-axes. Support for 64-bit integers. Auto-resizing axes.

  • 0.0.2
  • npm
  • Socket score

Version published
Maintainers
1
Created

Charted

A charting module written with backbone and raphael. Best used with browserify.

usage

// initial data
var data = [ 
    { key1: 4, time: 1367390411059 },
    { key1: 2, time: 1367390412059 },
    { key1: 3, time: 1367390413059 }
];

// set up chart instance
var Charted = require('charted');
var chart = new Charted({ 
    x_key: "time",
    data: data
});

// set series to plot
chart.plot({
   key: 'key1',
   color: 'red' 
});

Keywords

FAQs

Package last updated on 01 May 2013

Did you know?

Socket

Socket for GitHub automatically highlights issues in each pull request and monitors the health of all your open source dependencies. Discover the contents of your packages and block harmful activity before you install or update your dependencies.

Install

Related posts