Security News
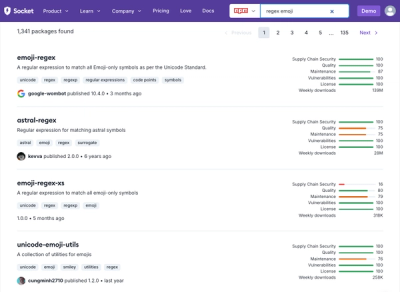
Weekly Downloads Now Available in npm Package Search Results
Socket's package search now displays weekly downloads for npm packages, helping developers quickly assess popularity and make more informed decisions.
chartjs-plugin-annotation
Advanced tools
The chartjs-plugin-annotation package is a plugin for Chart.js that allows you to add annotations to your charts. These annotations can be lines, boxes, or labels that highlight specific areas or points on the chart, making it easier to convey additional information or emphasize certain data points.
Line Annotation
This feature allows you to add a horizontal or vertical line to your chart. The line can be used to mark a specific value on the x or y axis. In this example, a horizontal line is added at the y-value of 25 with a label 'Threshold'.
{
type: 'line',
mode: 'horizontal',
scaleID: 'y-axis-0',
value: '25',
borderColor: 'red',
borderWidth: 2,
label: {
enabled: true,
content: 'Threshold'
}
}Box Annotation
This feature allows you to add a rectangular box to your chart. The box can highlight a specific area on the chart. In this example, a box is drawn from January to March on the x-axis and from 10 to 50 on the y-axis.
{
  type: 'box',
  xScaleID: 'x-axis-0',
  yScaleID: 'y-axis-0',
  xMin: 'January',
  xMax: 'March',
  yMin: 10,
  yMax: 50,
  backgroundColor: 'rgba(101, 33, 171, 0.5)',
  borderColor: 'rgb(101, 33, 171)',
  borderWidth: 1
}
Label Annotation
This feature allows you to add a label at a specific point on the chart. The label can contain text and can be styled with various options. In this example, a label is added at the point (February, 30) with the text 'This is a label'.
{
  type: 'label',
  xValue: 'February',
  yValue: 30,
  backgroundColor: 'rgba(0,0,0,0.8)',
  content: ['This is a label'],
  font: {
    size: 12
  },
  color: 'white',
  position: 'center'
}The chartjs-plugin-datalabels package is another plugin for Chart.js that allows you to display labels on data points. While chartjs-plugin-annotation focuses on adding annotations like lines and boxes, chartjs-plugin-datalabels is more about adding labels directly to the data points themselves.
The chartjs-plugin-zoom package provides zoom and pan functionalities for Chart.js charts. While it doesn't offer annotation features, it allows users to interact with the chart by zooming in and out or panning across the data, which can be useful for detailed data analysis.
The chartjs-plugin-crosshair package adds a crosshair to Chart.js charts, which can be used to highlight the exact position of the cursor on the chart. This is somewhat similar to annotations in that it helps to highlight specific points, but it is more focused on real-time interaction.
An annotation plugin for Chart.js >= 4.0.0
This plugin needs to be registered. It does not function as inline plugin.
For Chart.js 3.7.0 to 3.9.1 support, use version 2.2.1 of this plugin
For Chart.js 3.0.0 to 3.6.2 support, use version 1.4.0 of this plugin
For Chart.js 2.4.0 to 2.9.x support, use version 0.5.7 of this plugin
This plugin draws lines, boxes, points, labels, polygons and ellipses on the chart area.
Annotations work with line, bar, scatter and bubble charts that use linear, logarithmic, time, or category scales. Annotations will not work on any chart that does not have two or more axes, including pie, radar, and polar area charts.

You can find documentation for chartjs-plugin-annotation at www.chartjs.org/chartjs-plugin-annotation.
Before submitting an issue or a pull request to the project, please take a moment to look over the contributing guidelines first.
Chart.Annotation.js is available under the MIT license.
FAQs
Annotations for Chart.js
The npm package chartjs-plugin-annotation receives a total of 158,752 weekly downloads. As such, chartjs-plugin-annotation popularity was classified as popular.
We found that chartjs-plugin-annotation demonstrated a healthy version release cadence and project activity because the last version was released less than a year ago. It has 3 open source maintainers collaborating on the project.
Did you know?

Socket for GitHub automatically highlights issues in each pull request and monitors the health of all your open source dependencies. Discover the contents of your packages and block harmful activity before you install or update your dependencies.

Security News
Socket's package search now displays weekly downloads for npm packages, helping developers quickly assess popularity and make more informed decisions.

Security News
A Stanford study reveals 9.5% of engineers contribute almost nothing, costing tech $90B annually, with remote work fueling the rise of "ghost engineers."

Research
Security News
Socket’s threat research team has detected six malicious npm packages typosquatting popular libraries to insert SSH backdoors.