tempo - Time Series Utilities for Data Teams Using Databricks

Project Description
The purpose of this project is to make time series manipulation with Spark simpler. Operations covered under this package include AS OF joins, rolling statistics with user-specified window lengths, featurization of time series using lagged values, and Delta Lake optimization on time and partition fields.


Using the Project
Python - pip install in Databricks notebooks using:
%pip install dbl-tempo
Install locally using:
pip install dbl-tempo
Starting Point: TSDF object, a wrapper over a Spark data frame
The entry point into all features for time series analysis in tempo is a TSDF object which wraps the Spark data frame. At a high level, a TSDF contains a data frame which contains many smaller time series, one per partition key. In order to create a TSDF object, a distinguished timestamp column much be provided in order for sorting purposes for public methods. Optionally, a sequence number and partition columns can be provided as the assumptive columns on which to create new features from. Below are the public methods available for TSDF transformation and enrichment.
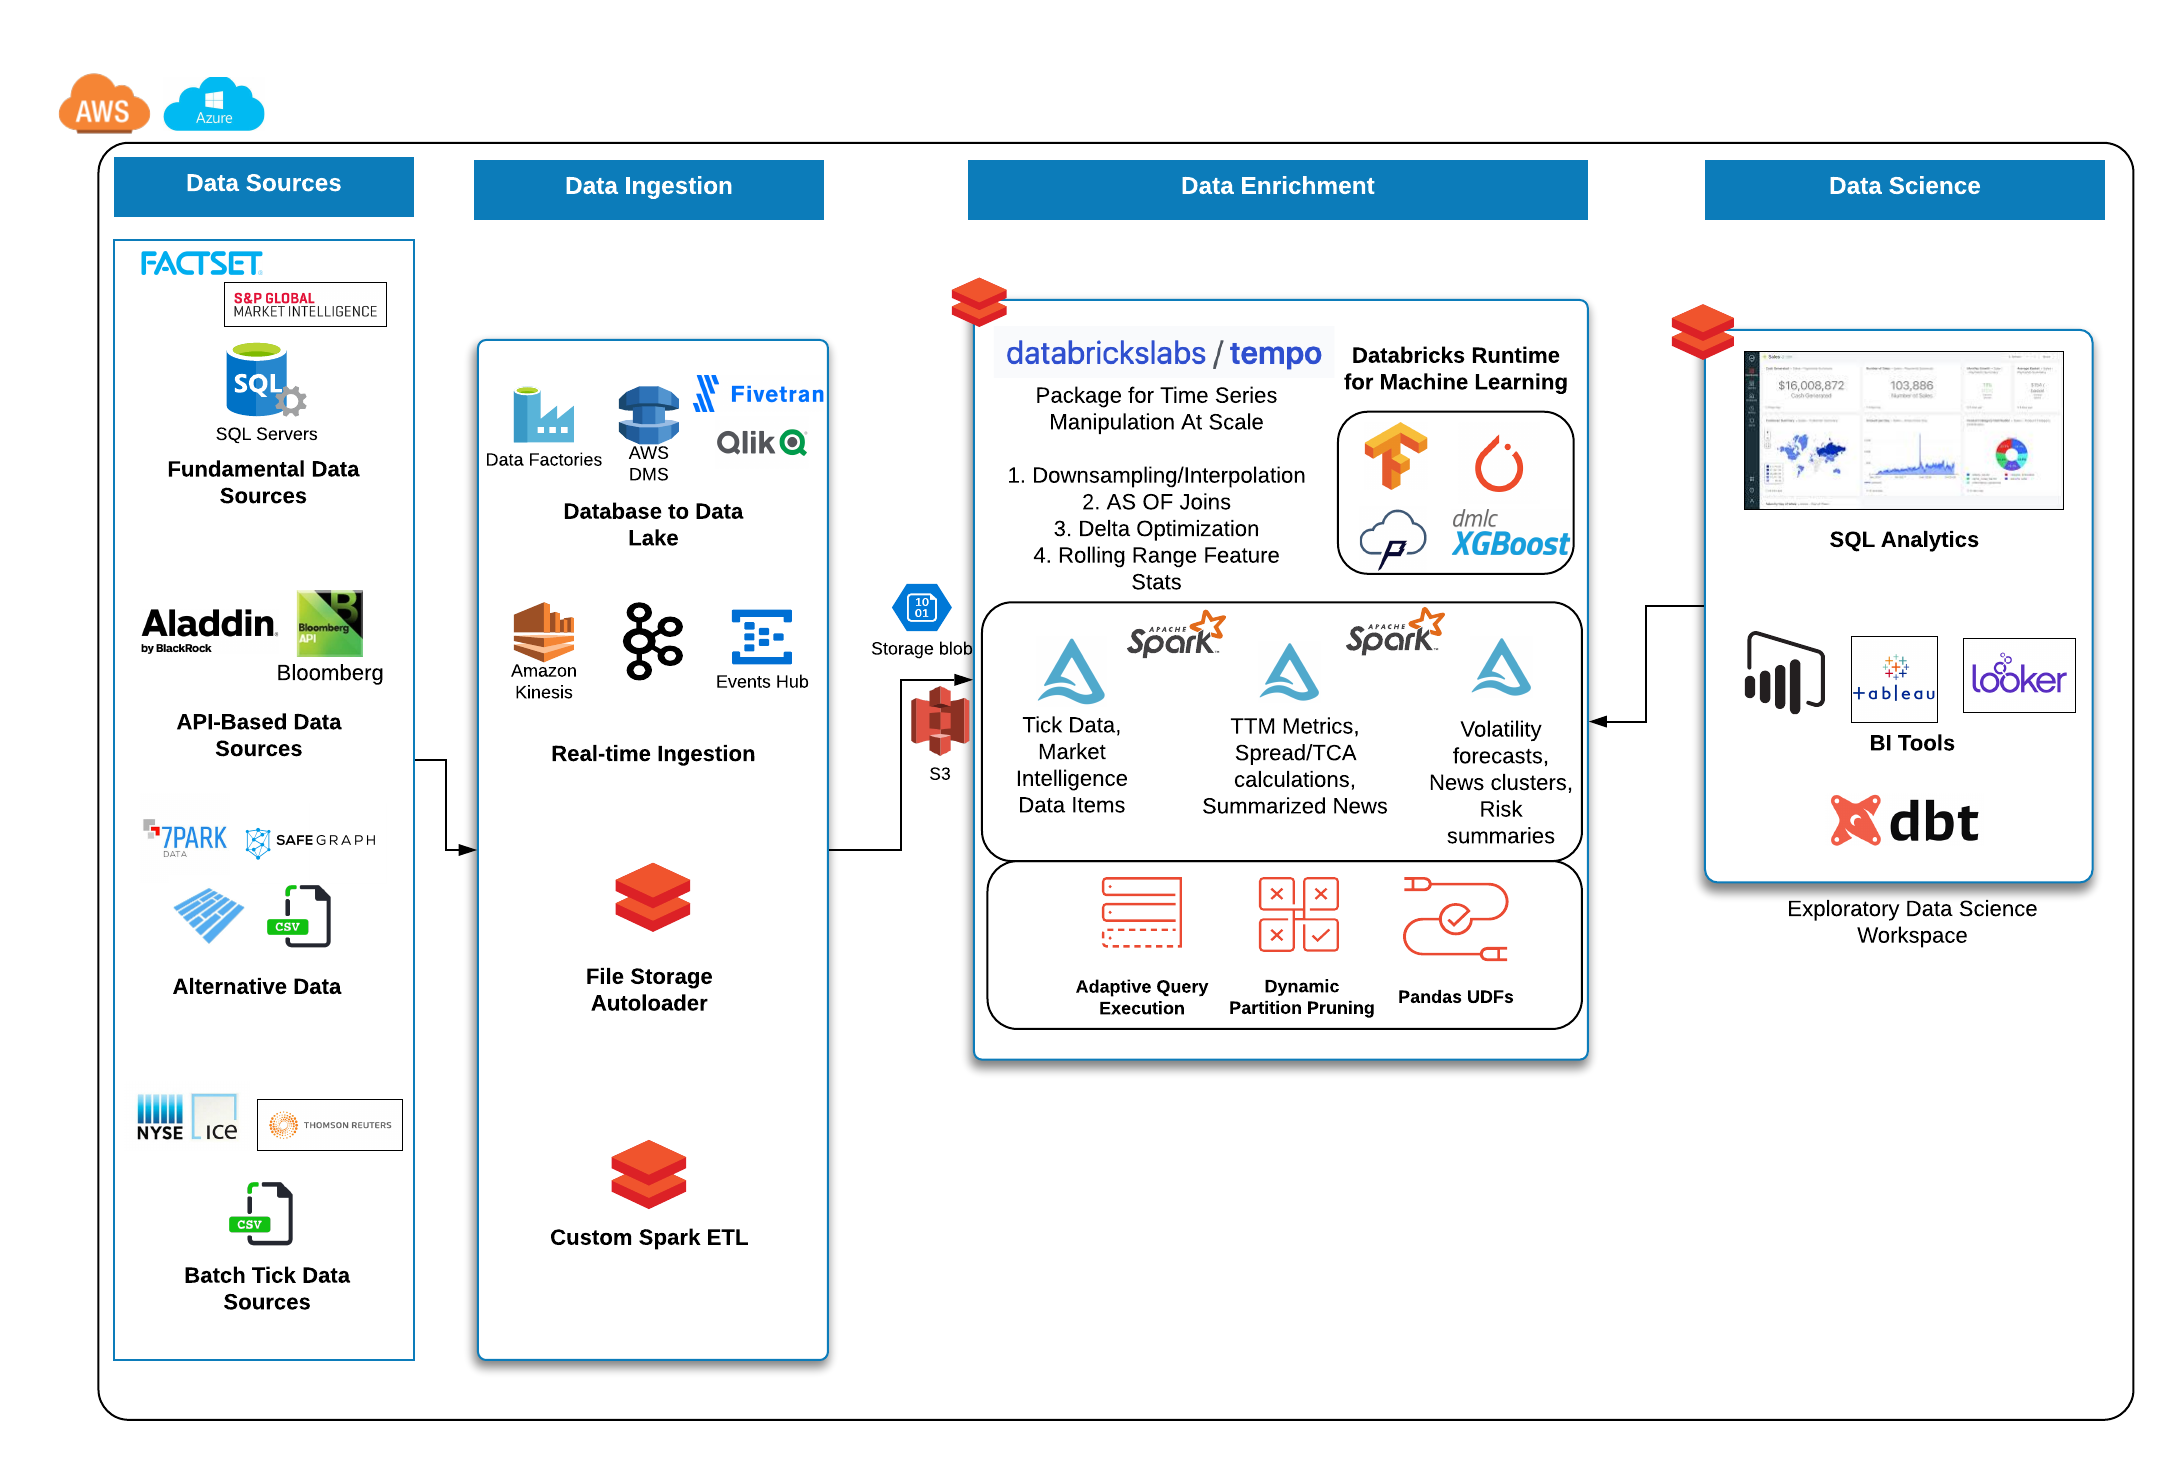
Sample Reference Architecture for Capital Markets
Quickstart - Python
Data source is UCI public accelerometer data available at this URL https://archive.ics.uci.edu/ml/datasets/Heterogeneity+Activity+Recognition
0. Read in Data and display it
from pyspark.sql.functions import *

phone_accel_df = spark.read.format("csv").option("header", "true").load("dbfs:/home/tempo/Phones_accelerometer").withColumn("event_ts", (col("Arrival_Time").cast("double")/1000).cast("timestamp")).withColumn("x", col("x").cast("double")).withColumn("y", col("y").cast("double")).withColumn("z", col("z").cast("double")).withColumn("event_ts_dbl", col("event_ts").cast("double"))

from tempo import *

phone_accel_tsdf = TSDF(phone_accel_df, ts_col="event_ts", partition_cols = ["User"])

display(phone_accel_tsdf)
1. Resample and Visualize
Sample usage:
Possible values for frequency include patterns such as 1 minute, 4 hours, 2 days or simply sec, min, day. For the accepted functions to aggregate data, options are 'floor', 'ceil', 'min', 'max', 'mean'. Custom functions will be available in a future release.
Note: You can upsample any missing values by using an option in the resample interface (fill = True)
resampled_sdf = phone_accel_tsdf.resample(freq='min', func='floor')
resampled_pdf = resampled_sdf.df.filter(col('event_ts').cast("date") == "2015-02-23").toPandas()
import plotly.graph_objs as go
import plotly.express as px
import pandas as pd
fig = px.line(resampled_pdf, x='event_ts', y='z',
color="User",
line_group="User", hover_name="User")
fig.update_layout(title='Phone Accelerometer Usage' , showlegend=False)
fig.show()
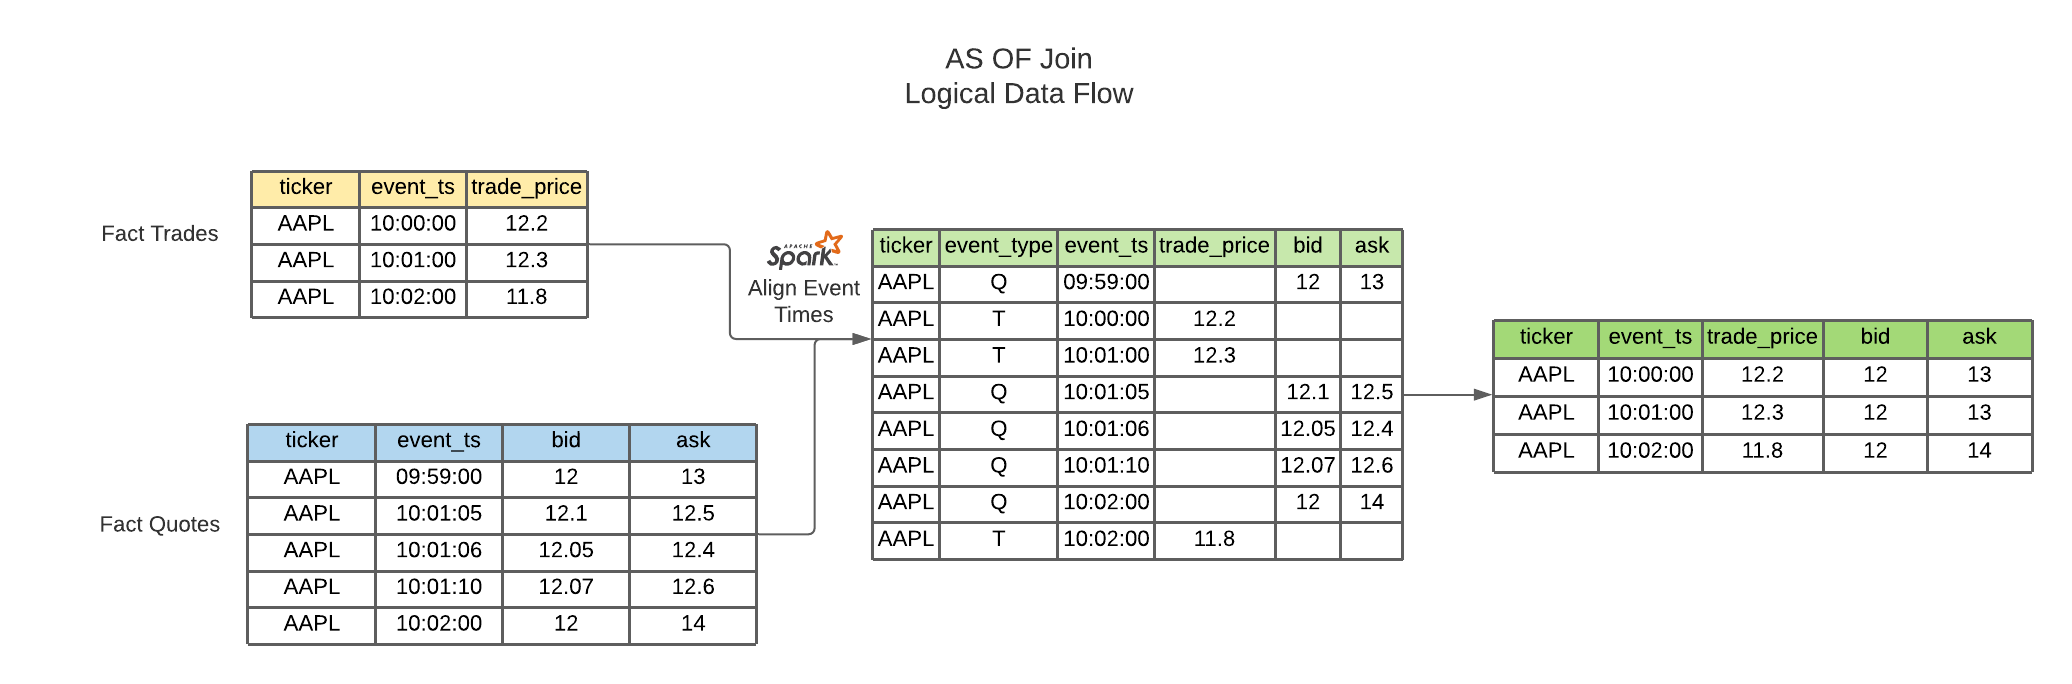
2. AS OF Join
This join uses windowing in order to select the latest record from a source table and merges this onto the base Fact table
from pyspark.sql.functions import *
watch_accel_df = spark.read.format("csv").option("header", "true").load("dbfs:/home/tempo/Watch_accelerometer").withColumn("event_ts", (col("Arrival_Time").cast("double")/1000).cast("timestamp")).withColumn("x", col("x").cast("double")).withColumn("y", col("y").cast("double")).withColumn("z", col("z").cast("double")).withColumn("event_ts_dbl", col("event_ts").cast("double"))
watch_accel_tsdf = TSDF(watch_accel_df, ts_col="event_ts", partition_cols = ["User"])
joined_df = watch_accel_tsdf.asofJoin(phone_accel_tsdf, right_prefix="phone_accel")
display(joined_df)
3. Skew Join Optimized AS OF Join
The purpose of the skew optimized as of join is to bucket each set of partition_cols to get the latest source record merged onto the fact table
Parameters:
ts_col = timestamp column for sorting
partition_cols = partition columns for defining granular time series for windowing and sorting
tsPartitionVal = value to break up each partition into time brackets
fraction = overlap fraction
right_prefix = prefix used for source columns when merged into fact table
joined_df = watch_accel_tsdf.asofJoin(phone_accel_tsdf, right_prefix="watch_accel", tsPartitionVal = 10, fraction = 0.1)
display(joined_df)
4 - Approximate Exponential Moving Average
The approximate exponential moving average uses an approximation of the form EMA = e * lag(col,0) + e * (1 - e) * lag(col, 1) + e * (1 - e)^2 * lag(col, 2) to define a rolling moving average based on exponential decay.
Parameters:
window = number of lagged values to compute for moving average
ema_trades = watch_accel_tsdf.EMA("x", window = 50)
display(ema_trades)
5 - Simple Moving Average
Method for computing rolling statistics based on the distinguished timestamp column
Parameters:
rangeBackWindowSecs = number of seconds to look back
moving_avg = watch_accel_tsdf.withRangeStats("y", rangeBackWindowSecs=600)
moving_avg.select('event_ts', 'x', 'y', 'z', 'mean_y').show(10, False)
6 - Fourier Transform
Method for transforming the time series to frequency domain based on the distinguished data column
Parameters:
timestep = timestep value to be used for getting the frequency scale
valueCol = name of the time domain data column which will be transformed
ft_df = tsdf.fourier_transform(timestep=1, valueCol="data_col")
display(ft_df)
7- Interpolation
Interpolate a series to fill in missing values using a specified function. The following interpolation methods are supported:
- Zero Fill :
zero - Null Fill:
null - Backwards Fill:
bfill - Forwards Fill:
ffill - Linear Fill:
linear
The interpolate method can either be use in conjunction with resample or independently.
If interpolate is not chained after a resample operation, the method automatically first re-samples the input dataset into a given frequency, then performs interpolation on the sampled time-series dataset.
Possible values for frequency include patterns such as 1 minute, 4 hours, 2 days or simply sec, min, day. For the accepted functions to aggregate data, options are 'floor', 'ceil', 'min', 'max', 'mean'.
NULL values after re-sampling are treated the same as missing values. Ability to specify NULL as a valid value is currently not supported.
Valid columns data types for interpolation are: ["int", "bigint", "float", "double"].
input_tsdf = TSDF(
input_df,
partition_cols=["partition_a", "partition_b"],
ts_col="event_ts",
)
interpolated_tsdf = input_tsdf.resample(freq="30 seconds", func="mean").interpolate(
method="linear"
)
interpolated_tsdf = input_tsdf.interpolate(
freq="30 seconds",
func="mean",
target_cols= ["columnA","columnB"],
method="linear"
)
interpolated_tsdf = input_tsdf.interpolate(
partition_cols=["partition_c"],
ts_col="other_event_ts"
freq="30 seconds",
func="mean",
target_cols= ["columnA","columnB"],
method="linear"
)
interpolated_tsdf = input_tsdf.interpolate(
partition_cols=["partition_c"],
ts_col="other_event_ts"
freq="30 seconds",
func="mean",
method="linear",
target_cols= ["columnA","columnB"],
show_interpolated=True,
)
8 - Grouped Stats by Frequency
Group by partition columns and a frequency to get the minimum, maximum, count, mean, standard deviation, and sum for all or some subset of numeric columns.
Parameters:
freq = (required) Frequency at which the grouping should take place - acceptable parameters are strings of the form "1 minute", "40 seconds", etc.
metricCols = (optional) List of columns to compute metrics for. These should be numeric columns. If this is not supplied, this method will compute stats on all numeric columns in the TSDF
grouped_stats = watch_accel_tsdf.withGroupedStats(metricCols = ["y"], freq="1 minute")
display(grouped_stats)
Project Support
Please note that all projects in the /databrickslabs github account are provided for your exploration only, and are not formally supported by Databricks with Service Level Agreements (SLAs). They are provided AS-IS and we do not make any guarantees of any kind. Please do not submit a support ticket relating to any issues arising from the use of these projects.
Any issues discovered through the use of this project should be filed as GitHub Issues on the Repo. They will be reviewed as time permits, but there are no formal SLAs for support.
Project Setup
After cloning the repo, it is highly advised that you create a virtual environment to isolate and manage
packages for this project, like so:
python -m venv <path to project root>/venv
Then, install the required modules via pip:
pip install -r requirements.txt
Building the Project
Once in the main project folder, build into a wheel using the following command:
python setup.py bdist_wheel
Releasing the Project
Instructions for how to release a version of the project


