DenMune: A Density-Peak Clustering Algorithm
DenMune is a clustering algorithm that can find clusters of arbitrary size, shapes, and densities in two-dimensions. Higher dimensions are first reduced to 2D using t-SNE. The algorithm relies on a single parameter K (the number of nearest neighbors). The results show the superiority of the algorithm. Enjoy the simplicity but the power of DenMune.
Reproducibility & Test Drives
Now you can reproduce all the research experiments, and even share the results and collaborate with the algorithm using our capsule on CodeOcean. Each Capsule is a self-contained computational experiment with computing environment, code, data, version history, and results.
Also, you may use our repo2docker offered by mybinder.org, which encapsulates the algorithm and all required data in one virtual machine instance. All Jupyter notebooks examples found in this repository will be also available to you in action to practice in this respo2docer. Thanks mybinder.org, you made it possible!
| Test-drive | URL |
|---|
| Reproduce our code capsule on Code Ocean |  |
| Use our test-drive on MyBinder |  |
Scientific Work
| Paper & data | Journals | ResearchGate Stats |
|---|

 |   | 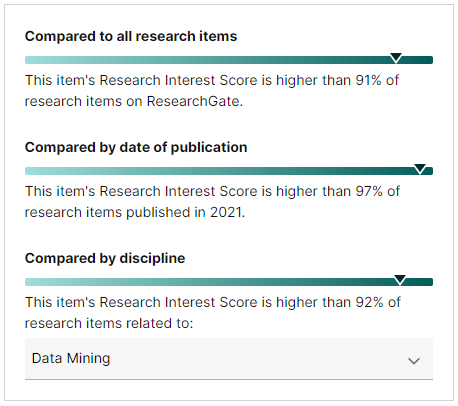 |
Coding, Security & Maintenance
| Code Style | Installation | CI Workflow | Code Coverage | Code Scanning |
|---|
 |  |  |  |  |
Tutorials
| Reproducible Capsule | Repo2Docker | Colab | Kaggle |
|---|
| |  |  |
Downloads Stats
| Download/Week | Download/Month | Total Downloads |
|---|
 |  |  |
Based on the paper
| Paper |
|---|
| Mohamed Abbas, Adel El-Zoghabi, Amin Shoukry, |
| DenMune: Density peak based clustering using mutual nearest neighbors |
| In: Journal of Pattern Recognition, Elsevier, |
| volume 109, number 107589, January 2021 |
| DOI: https://doi.org/10.1016/j.patcog.2020.107589 |
Documentation:
Watch it in action
This 30 seconds will tell you how a density-based algorithm, DenMune propagates:

Still interested?
Watch this 10-min illustrative video on:
When less means more
Most classic clustering algorithms fail to detect complex clusters where clusters are of different sizes, shapes, density, and exist in noisy data. Recently, a density-based algorithm named DenMune showed great ability in detecting complex shapes even in noisy data. it can detect a number of clusters automatically, detect both pre-identified-noise and post-identified-noise automatically, and remove them.
It can achieve an accuracy reach 100% in some classic pattern problems, achieve 97% in the MNIST dataset. A great advantage of this algorithm is being a single-parameter algorithm. All you need is to set a number of k-nearest neighbors and the algorithm will care about the rest. Being Non-sensitive to changes in k, make it robust and stable.
Keep in mind, that the algorithm reduces any N-D dataset to only a 2-D dataset initially, so it is a good benefit of this algorithm is always to plot your data and explore it which makes this algorithm a good candidate for data exploration. Finally, the algorithm comes with a neat package for visualizing data, validating it, and analyzing the whole clustering process.
How to install DenMune
Simply install DenMune clustering algorithm using pip command from the official Python repository
From the shell run the command
pip install denmune
From Jupyter notebook cell run the command
!pip install denmune
How to use DenMune
Once DenMune is installed, you just need to import it
from denmune import DenMune
Please note that first denmune (the package) in small letters, while the other one(the class itself) has D and M in capital case.
Read data
There are four possible cases of data:
- only train data without labels
- only labeled train data
- labeled train data in addition to test data without labels
- labeled train data in addition to labeled test data
data_path = 'datasets/denmune/chameleon/'
dataset = "t7.10k.csv"
data_file = data_path + dataset
X_train = pd.read_csv(data_file, sep=',', header=None)
knn = 39
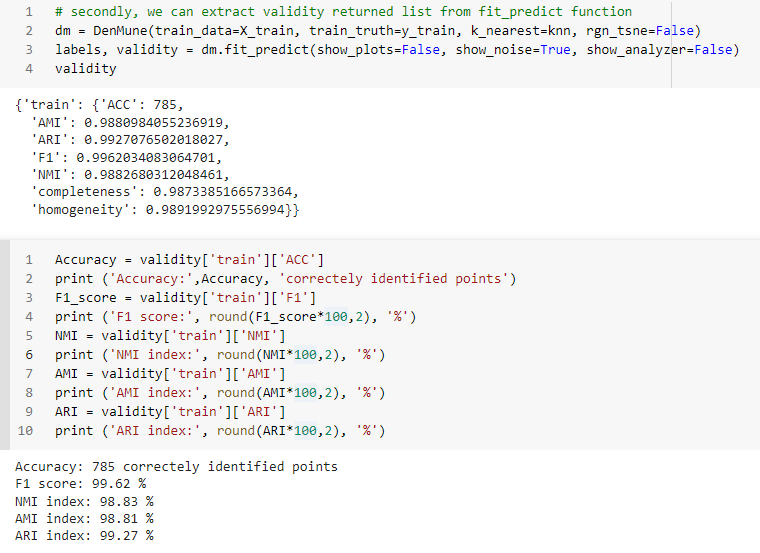
dm = DenMune(train_data=X_train, k_nearest=knn)
labels, validity = dm.fit_predict(show_analyzer=False, show_noise=True)
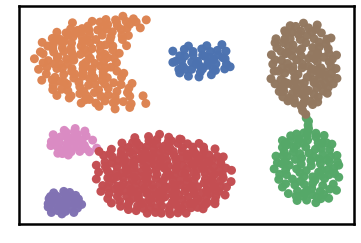
This is an intuitive dataset which has no groundtruth provided
data_path = 'datasets/denmune/shapes/'
dataset = "aggregation.csv"
data_file = data_path + dataset
X_train = pd.read_csv(data_file, sep=',', header=None)
y_train = X_train.iloc[:, -1]
X_train = X_train.drop(X_train.columns[-1], axis=1)
knn = 6
dm = DenMune(train_data=X_train, train_truth= y_train, k_nearest=knn)
labels, validity = dm.fit_predict(show_analyzer=False, show_noise=True)
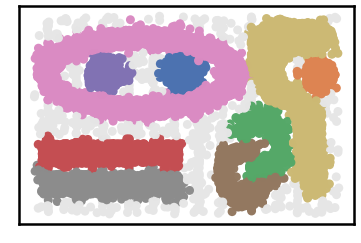
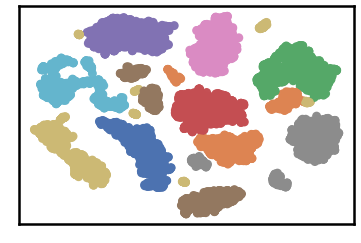
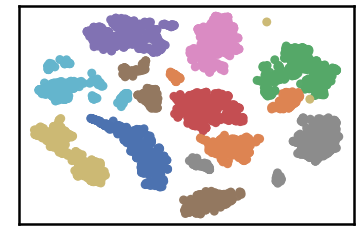
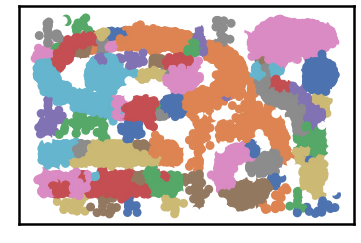
Datset groundtruth

Dataset as detected by DenMune at k=6
data_path = 'datasets/denmune/pendigits/'
file_2d = data_path + 'pendigits-2d.csv'
X_train = pd.read_csv(data_path + 'train.csv', sep=',', header=None)
y_train = X_train.iloc[:, -1]
X_train = X_train.drop(X_train.columns[-1], axis=1)
X_test = pd.read_csv(data_path + 'test.csv', sep=',', header=None)
X_test = X_test.drop(X_test.columns[-1], axis=1)
knn = 50
dm = DenMune(train_data=X_train, train_truth= y_train,
test_data= X_test,
k_nearest=knn)
labels, validity = dm.fit_predict(show_analyzer=True, show_noise=True)
dataset groundtruth
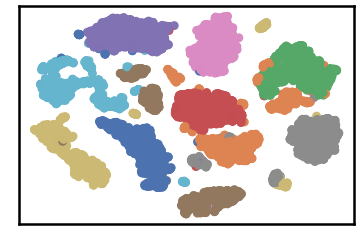
dataset as detected by DenMune at k=50
test data as predicted by DenMune on training the dataset at k=50
Algorithm's Parameters
- Parameters used within the initialization of the DenMune class
def __init__ (self,
                  train_data=None, test_data=None,
                  train_truth=None, test_truth=None,
                  file_2d =None, k_nearest=1,
                  rgn_tsne=False, prop_step=0,
                  ):
- Parameters used within the fit_predict function:
def fit_predict(self,
                    validate=True,
                    show_plots=True,
                    show_noise=True,
                    show_analyzer=True
                    ):
- validate:
- validate data on/off according to five measures integrated with DenMune (Accuracy. F1-score, NMI index, AMI index, ARI index)
- default: True
- show_plots:
- show/hide plotting of data
- default: True
- show_noise:
- show/hide noise and outlier
- default: True
- show_analyzer:
- show/hide the analyzer
- default: True
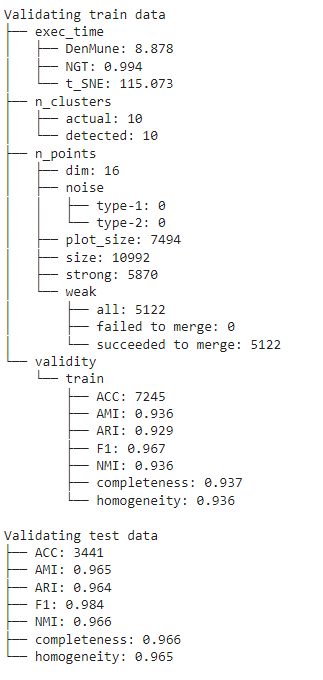
The Analyzer
The algorithm provide an exploratory tool called analyzer, once called it will provide you with in-depth analysis on how your clustering results perform.
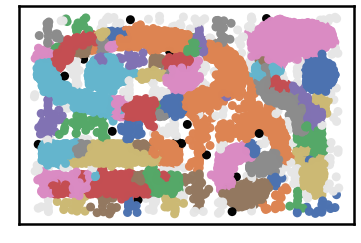
Noise Detection
DenMune detects noise and outlier automatically, no need to any further work from your side.
- It plots pre-identified noise in black
- It plots post-identified noise in light grey
You can set show_noise parameter to False.
m = DenMune(train_data=X_train, k_nearest=knn)
labels, validity = dm.fit_predict(show_noise=True)
m = DenMune(train_data=X_train, k_nearest=knn)
labels, validity = dm.fit_predict(show_noise=False)
| noisy data | clean data |
|---|
 |  |
Validation
You can get your validation results using 3 methods
- by showing the Analyzer
- extract values from the validity returned list from fit_predict function
- extract values from the Analyzer dictionary
- There are five validity measures built-in the algorithm, which are:
- ACC, Accuracy
- F1 score
- NMI index (Normalized Mutual Information)
- AMI index (Adjusted Mutual Information)
- ARI index (Adjusted Rand Index)
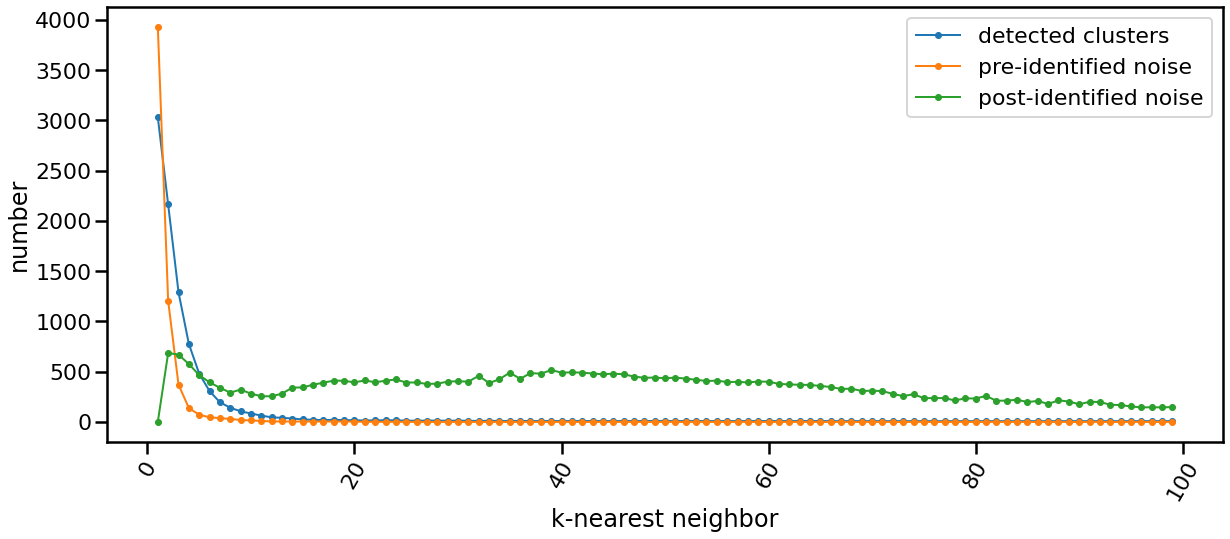
K-nearest Evolution
The following chart shows the evolution of pre and post identified noise in correspondence to increase of number of knn. Also, detected number of clusters is analyzed in the same chart in relation with both types of identified noise.
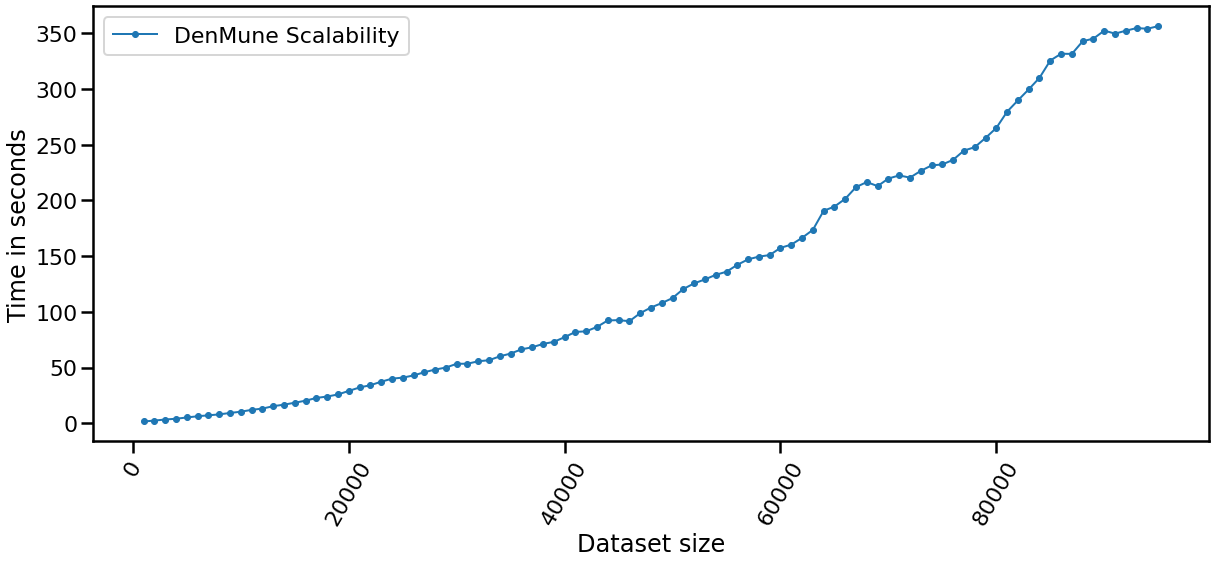
The Scalability
| Data Size | Time |
|---|
| data size: 5000 | time: 2.3139 seconds |
| data size: 10000 | time: 5.8752 seconds |
| data size: 15000 | time: 12.4535 seconds |
| data size: 20000 | time: 18.8466 seconds |
| data size: 25000 | time: 28.992 seconds |
| data size: 30000 | time: 39.3166 seconds |
| data size: 35000 | time: 39.4842 seconds |
| data size: 40000 | time: 63.7649 seconds |
| data size: 45000 | time: 73.6828 seconds |
| data size: 50000 | time: 86.9194 seconds |
| data size: 55000 | time: 90.1077 seconds |
| data size: 60000 | time: 125.0228 seconds |
| data size: 65000 | time: 149.1858 seconds |
| data size: 70000 | time: 177.4184 seconds |
| data size: 75000 | time: 204.0712 seconds |
| data size: 80000 | time: 220.502 seconds |
| data size: 85000 | time: 251.7625 seconds |
| data size: 100000 | time: 257.563 seconds |
|
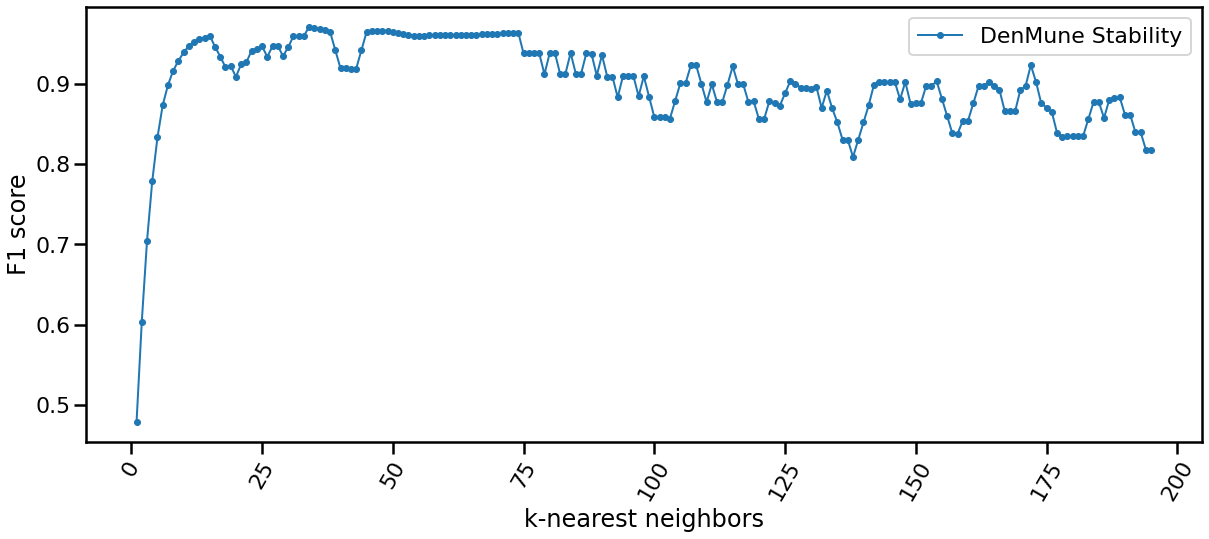
The Stability
The algorithm is only single-parameter, even more it not sensitive to changes in that parameter, k. You may guess that from the following chart yourself. This is of great benefit for you as a data exploration analyst. You can simply explore the dataset using an arbitrary k. Being Non-sensitive to changes in k, make it robust and stable.
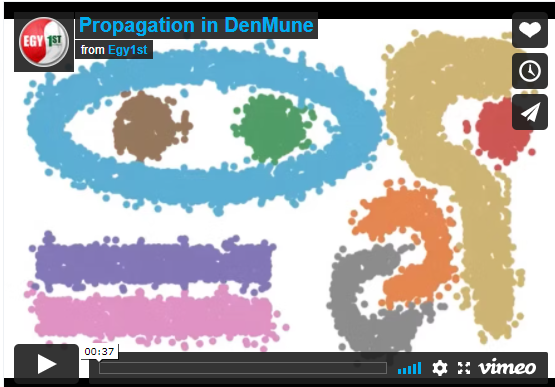
Reveal the propagation
One of the top performing features in this algorithm is enabling you to watch how your clusters propagate to construct the final output clusters. Just use the parameter 'prop_step' as in the following example:
dataset = "t7.10k"
data_path = 'datasets/denmune/chameleon/'
data_file = data_path + dataset +'.csv'
X_train = pd.read_csv(data_file, sep=',', header=None)
from itertools import chain
knn = 39
snapshots = chain(range(2,5), range(5,50,10), range(50, 100, 25), range(100,500,100), range(500,2000, 250), range(1000,5500, 500))
from IPython.display import clear_output
for snapshot in snapshots:
print ("itration", snapshot )
clear_output(wait=True)
dm = DenMune(train_data=X_train, k_nearest=knn, rgn_tsne=False, prop_step=snapshot)
labels, validity = dm.fit_predict(show_analyzer=False, show_noise=False)
Interact with the algorithm
click image to interact
This notebook allows you interact with the algorithm in many aspects:
- you can choose which dataset to cluster (among 4 chameleon datasets)
- you can decide which number of k-nearest neighbor to use
- show noise on/off; thus you can invesetigate noise detected by the algorithm
- show analyzer on/off
We love Jupyter Notebooks
Need to test examples one by one, then here other two options
- Use colab offered by google research to test each example individually.
- If you are a kaggler like me, then Kaggle, the best workspace where data scientist meet, should fit you to test the algorithm with great experience.
Here is a list of Google CoLab & Kaggle notebooks to practice the use of the algorithm interactively.
| Dataset | CoLab Notebook | Kaggle Notebook |
|---|
| How to use it? | | |
| Chameleon datasets | | |
| 2D Shape datasets | | |
| Clustering unlabeled data | | |
| iris dataset | | |
| MNIST dataset | | |
| Scoring 97% on MNIST dataset | | |
| Noise detection | | |
| Validation | | |
| How does it propagate? | |
|
| Snapshots of propagation | | |
| Scalability | | |
| Stability | | |
| k-nearest-evolution | | |
Software Impact
Discover robust clustering without density cutoffs using this open-source Python library pyMune, implementing the parameter-free DenMune algorithm. PyMune identifies and expands cluster cores while removing noise. Fully scikit-learn compatible. pyMune (DenMune implementation) is a cutting-edge tool incorporating advanced techniques, robust performance, and effective propagation strategies. This positions it as the current state-of-the-art in its field, contributing to its high adoption and impact.
- After extensive research and rigorous validation, we are proud to release pyMune as an open-source tool on GitHub and PyPi for the benefit of the scientific community.
- With over 200,000 downloads already, pyMune has demonstrated its real-world impact and usefulness. We integrated it with and to further enhance reproducibility and reuse - encapsulating code, data, and outputs for turnkey sharing.
- It is part of a special issue of R-badged articles, https://www.sciencedirect.com/journal/software-impacts/special-issue/10XXN6LQ0J1
- it is part of Scikit-learn-contrib , https://github.com/scikit-learn-contrib

How to cite
If you have used this codebase in a scientific publication and wish to cite it, please use the Journal of Pattern Recognition article:
Mohamed Abbas, Adel El-Zoghaby, Amin Shoukry, *DenMune: Density peak-based clustering using mutual nearest neighbors*
In: Journal of Pattern Recognition, Elsevier, volume 109, number 107589.
January 2021
@article{ABBAS2021107589,
title = {DenMune: Density peak-based clustering using mutual nearest neighbors},
journal = {Pattern Recognition},
volume = {109},
pages = {107589},
year = {2021},
issn = {0031-3203},
doi = {https://doi.org/10.1016/j.patcog.2020.107589},
url = {https://www.sciencedirect.com/science/article/pii/S0031320320303927},
author = {Mohamed Abbas and Adel El-Zoghabi and Amin Shoukry},
keywords = {Clustering, Mutual neighbors, Dimensionality reduction, Arbitrary shapes, Pattern recognition, Nearest neighbors, Density peak},
abstract = {Many clustering algorithms fail when clusters are of arbitrary shapes, of varying densities, or the data classes are unbalanced and close to each other, even in two dimensions. A novel clustering algorithm, “DenMune” is presented to meet this challenge. It is based on identifying dense regions using mutual nearest neighborhoods of size K, where K is the only parameter required from the user, besides obeying the mutual nearest neighbor consistency principle. The algorithm is stable for a wide range of values of K. Moreover, it is able to automatically detect and remove noise from the clustering process as well as detect the target clusters. It produces robust results on various low and high-dimensional datasets relative to several known state-of-the-art clustering algorithms.}
}
Abbas, M. A., El-Zoghabi, A., & Shoukry, A. (2023). PyMune: A Python package for complex clusters detection. Software Impacts, 17, 100564. https://doi.org/10.1016/j.simpa.2023.100564
@article{ABBAS2023100564,
title = {pyMune: A Python package for complex clusters detection},
journal = {Software Impacts},
volume = {17},
pages = {100564},
year = {2023},
issn = {2665-9638},
doi = {https://doi.org/10.1016/j.simpa.2023.100564},
url = {https://www.sciencedirect.com/science/article/pii/S266596382300101X},
author = {Mohamed Ali Abbas and Adel El-Zoghabi and Amin Shoukry},
keywords = {Machine learning, Pattern recognition, Dimensionality reduction, Mutual nearest neighbors, Nearest neighbors approximation, DenMune},
abstract = {We introduce pyMune, an open-source Python library for robust clustering of complex real-world datasets without density cutoff parameters. It implements DenMune (Abbas et al., 2021), a mutual nearest neighbor algorithm that uses dimensionality reduction and approximate nearest neighbor search to identify and expand cluster cores. Noise is removed with a mutual nearest-neighbor voting system. In addition to clustering, pyMune provides classification, visualization, and validation functionalities. It is fully compatible with scikit-learn and has been accepted into the scikit-learn-contrib repository. The code, documentation, and demos are available on GitHub, PyPi, and CodeOcean for easy use and reproducibility.}
}
Licensing
The DenMune algorithm is 3-clause BSD licensed. Enjoy.

Task List


