

NeuroPyxels: loading, processing and plotting Neuropixels data in Python
NeuroPyxels (npyx) is a python library built for electrophysiologists using Neuropixels electrodes. This package results from the needs of a pythonist who really did not want to transition to MATLAB to work with Neuropixels: it features a suite of core utility functions for loading, processing and plotting Neuropixels data.
❓Any questions or issues?: Create a github issue to get support, or create a pull request. Alternatively, you can email us: maximebeaujeanroch047[at]gmail[dot]com. You can also use the Neuropixels slack workgroup.
⬇️ Installation:
We recommend using a conda environment. Pre-existing packages on a python installation might be incompatible with npyx and break your installation. You can find instructions on setting up a conda environment here.
conda create -n my_env python=3.10
conda activate my_env
pip install npyx
conda install -c conda-forge cupy cudatoolkit=11.0
python -c 'import npyx'
Advanced installation
-
if you want the very latest version:
conda create -n my_env python=3.10
conda activate my_env
pip install git+https://github.com/m-beau/NeuroPyxels@master
conda install -c conda-forge cupy cudatoolkit=11.0
python -c 'import npyx'
-
If you want to edit npyx locally and eventually contribute:
💡 Tip: in an ipython/jupyter session, use %load_ext autoreload then %autoreload 2 to make your local edits active in your session without having to restart your kernel. Amazing for development.
conda create -n my_env python=3.10
conda activate my_env
cd path/to/save_dir
git clone https://github.com/m-beau/NeuroPyxels
cd NeuroPyxels
pip install .
conda install -c conda-forge cupy cudatoolkit=11.0
python -c 'import npyx'
and pull every now and then:
cd path/to/save_dir/NeuroPyxels
git pull
Npyx supports Python >=3.7.
Dealing with cupy (GPU shenanigans)
To run some preprocessing functions, you will need NVIDIA drivers and cuda-toolkit installed on your computer. It is a notorious source of bugs. To test your CUDA installation do the following:
nvidia-smi
nvcc
If it doesn't work, try up/downgrading the version of cudatoolkit installed:
conda activate my_env
conda list cudatoolkit
conda activate my_env
conda remove cupy, cudatoolkit
conda install -c conda-forge cupy cudatoolkit=10.0
Test installation
You can use the built-in unit testing function 'test_npyx' to make sure that npyx core functions run smoothly, all at once.
from npyx.testing import test_npyx
dp = 'datapath/to/myrecording'
test_npyx(dp)
test_npyx(dp, raise_error=True)
--- npyx version 2.3.4 unit testing initiated, on directory /media/maxime/AnalysisSSD/test_dataset_artefact...
--- Successfully ran 'read_metadata' from npyx.inout.
--- Successfully ran 'get_npix_sync' from npyx.inout.
--- Successfully ran 'get_units' from npyx.gl.
--- Successfully ran 'ids' from npyx.spk_t.
--- Successfully ran 'trn' from npyx.spk_t.
--- Successfully ran 'trn_filtered' from npyx.spk_t.
--- Successfully ran 'wvf' from npyx.spk_wvf.
--- Successfully ran 'wvf_dsmatch' from npyx.spk_wvf.
--- Successfully ran 'get_peak_chan' from npyx.spk_wvf.
--- Successfully ran 'templates' from npyx.spk_wvf.
--- Successfully ran 'ccg' from npyx.corr.
--- Successfully ran 'plot_wvf' from npyx.plot.
--- Successfully ran 'plot_ccg' from npyx.plot.
--- Successfully ran 'plot_raw' from npyx.plot.
(bunch of plots...)
:warning: Known installation issues
-
cannot import numba.core hence cannot import npyx
Older versions of numba did not feature the .core submodule. If you get this error, you are probably running a too old version of numba. Make sure that you have installed npyx in a fresh conda environment if that happens to you. If you still get an error, check that numba is not installed in your root directory.
pip uninstall numba
conda activate my_env
pip uninstall numba
pip install numba
- core dumped when importing
This seems to be an issue related to PyQt5 required by opencv (opencv-python).
Solution (from post):
# activate npyx environment first
pip uninstall PyQt5
pip uninstall opencv-python
pip install opencv-python
# pip install other missing dependencies
Full log:
In [1]: from npyx import *
In [2]: QObject::moveToThread: Current thread (0x5622e1ea6800) is not the object's thread (0x5622e30e86f0).
Cannot move to target thread (0x5622e1ea6800)

qt.qpa.plugin: Could not load the Qt platform plugin "xcb" in "/home/maxime/miniconda3/envs/npyx/lib/python3.7/site-packages/cv2/qt/plugins" even though it was found.
This application failed to start because no Qt platform plugin could be initialized. Reinstalling the application may fix this problem.

Available platform plugins are: xcb, eglfs, linuxfb, minimal, minimalegl, offscreen, vnc, wayland-egl, wayland, wayland-xcomposite-egl, wayland-xcomposite-glx, webgl.

Aborted (core dumped)
- I think I installed everything properly, but npyx is not found if I run 'python -c "import npyx" '!
Typically:
Traceback (most recent call last):
  File "<stdin>", line 1, in <module>
ModuleNotFoundError: No module named 'npyx'
Make sure that the python installation that you are using is indeed the version of your new environment.
To do so, in your terminal, run "which python" on linux/mac or "where python" on windows: the output should be the path to the right environment e.g. "/home/.../anaconda/envs/npyx/bin/python". If it isn't, try to deactivate/reactivate your conda environment, or make sure you do not have conflicting python installations on your machine.
🤗 Support and citing
If you find Neuropyxels useful in your work, we kindly request that you cite:
Maxime Beau, Federico D'Agostino, Ago Lajko, Gabriela Martínez, Michael Häusser & Dimitar Kostadinov. NeuroPyxels: loading, processing and plotting Neuropixels data in python. Zenodo https://doi.org/10.5281/zenodo.5509733 (2021).
You can additionally star this repo using the top-right star button to help it gain more visibility.
Cheers!
🔍️ Documentation:
Npyx works with the data formatting employed by SpikeGLX and OpenEphys (binary data and meta data) used in combination with Phy-compatible spike-sorters (Kilosort, SpyKING CIRCUS...). Any dataset compatible with phy can also be analyzed with npyx, in essence.
💡 Design philosophy
-
Memoization (a.k.a. caching)
Npyx is fast because it rarely computes the same thing twice by relying heavily on caching (memoization as purists like to call it) - in the background, it saves most relevant outputs (spike trains, waveforms, correlograms...) at npix_dataset/npyxMemory, from where they are simply reloaded if called again.
An important argument controlling this behaviour is again (boolean), by default set to False: if True, NeuroPyxels cached functions will recompute their output rather than loading it from npyxMemory. This is important to be aware of this behaviour, as it can lead to mind boggling bugs. For instance, if you load a spike train then re-curate your dataset, e.g. by splitting unit 56 into 504 and 505, the train of the old 'unit 56' will still exist at kilosort_dataset/npyxMemory and you will remain able to load it even though the unit is gone!
Under the hood, NeuroPyxels caching is handled with another package of mine, cachecache (as of July 2024). Functions cached with cachecache's decorator (named @npyx_cache in NeuroPyxels) can have their caching behaviour altered at call time with three arguments: again (mentioned earlier), cache_results, and cache_path. If again is set to True (False by default), the results are recomputed rather than loaded from cache. If cache_results is set to False (True by default), the results will not be cached on disk and therefore will not take up any space. If cache_path is set to a string, the results will be cached in the directory specified by the string. If cache_path is set to None (default), the results will be cached in the default directory, which is ~/.NeuroPyxels and can be customized by simply editing the __cachedir__ directory inside ./npyx/CONFIG.py (where NeuroPyxels is installed on your machine). For cached functions that use the dp argument, the default cache directory is {dp}/npyxMemory, not the path specified in ./npyx/CONFIG.py.
If you wish to grant your functions with the same caching capabilities, I wrote a very complete documentation in cachecache's README. You can install it independently with pip install cachecache.
General tip: if your data loaded with NeuroPyxels seems incomprehensibly odd at times, try re-running the function with again=True. Joblib sometimes makes mistakes and I am yet to put my finger on what causes them - this is an ugly but quick and reliable fix.
-
Ubiquitous arguments
Most npyx functions take at least one input: dp, which is the path to your Neuropixels-phy dataset. You can find a full description of the structure of such datasets on the phy documentation.
Other typical parameters are: verbose (whether to print a bunch of informative messages, useful when debugging), saveFig (boolean) and saveDir (whether to save the figure in saveDir for plotting functions).
Importantly, dp can also be the path to a merged dataset, generated with npyx.merge_datasets() - every function will run as smoothly on merged datasets as on any regular dataset. See below for more details.
-
Minimal and modular reliance of spike-sorter output
Every function requires the files myrecording.ap.meta/myrecording.oebin (metadata from SpikeGLX/OpenEphys), params.py, spike_times.npy and spike_clusters.npy.
If you have started spike sorting, cluster_groups.tsv will also be required obviously (will be created filled with 'unsorted' groups if none is found).
Then, specific functions will require specific files: loading waveforms with npyx.spk_wvf.wvf or extracting your sync channel with npyx.io.get_npix_sync require the raw data myrecording.ap.bin, npyx.spk_wvf.templates the files templates.npy and spike_templates.npy, and so on. This allows you to only transfer the strictly necassary files for your use case from a machine to the next: for instance, if you only want to make behavioural analysis of spike trains but do not care about the waveforms, you can run get_npix_sync on a first machine (which will generate a sync_chan folder containing extracted onsets/offsets from the sync channel(s)), then exclusively transfer the dataset/sync_chan/ folder along with spike_times.npy and spike_clusters.npy (all very light files) on another computer and analyze your data there seemlessly.
📁 Directory structure
The dp parameter of all npyx functions must be the absolute path to myrecording below.
For SpikeGLX recordings:
myrecording/
  myrecording.ap.meta
  params.py
  spike_times.npy
  spike_clusters.npy
  cluster_groups.tsv # optional, if manually curated with phy
  myrecording.ap.bin # optional, if wanna plot waveforms

  # other kilosort/spyking circus outputs here
For Open-Ephys recordings:
myrecording/
  myrecording.oebin
  params.py
  spike_times.npy
  spike_clusters.npy
  cluster_groups.tsv # if manually curated with phy

  # other spikesorter outputs here

  continuous/
    Neuropix-PXI-100.somethingsomething (1, AP...)/
      continuous.dat # optional, if wanna plot waveforms
    Neuropix-PXI-100.somethingsomething (2, LFP...)/
      continuous.dat # optional, if want to plot LFP with plot_raw

  events/
    Neuropix-PXI-100.somethingsomething (1, AP...)/
      TTL somethingelse/
        timestamps.npy # optional, if need to get synchronyzation channel to load with get_npix_sync e.g. to merge datasets
    Neuropix-PXI-100.somethingsomething (2, LFP...)/
      TTL somethingelse/
        timestamps.npy # same timestamps for LFP channel
👉 Common use cases
General tip: if your data loaded with NeuroPyxels seems incomprehensibly odd at times, try re-running the function with again=True. Joblib sometimes makes mistakes and I am yet to put my finger on what causes them - this is an ugly but quick and reliable fix.
Load recording metadata
from npyx import *
dp = 'datapath/to/myrecording'
meta = read_metadata(dp)
Load synchronization channel
from npyx.inout import get_npix_sync
onsets, offsets = get_npix_sync(dp, filt_key='highpass')
Preprocess binary data
Makes a preprocessed copy of the binary file in dp, moves original binary file at dp/original_data
This will be as fast as literally copying your file, with a decent GPU!
from npyx.inout import preprocess_binary_file
filtered_fname = preprocess_binary_file(dp, filt_key='ap', median_subtract=True, f_low=None, f_high=300, order=3, verbose=True)
Get good units from dataset
from npyx.gl import get_units
units = get_units(dp, quality='good')
Load spike times from unit u
from npyx.spk_t import trn
u=234
t = trn(dp, u)
Load waveforms from unit u
from npyx.inout import read_spikeglx_meta
from npyx.spk_t import ids, trn
from npyx.spk_wvf import get_peak_chan, wvf, templates
waveforms = wvf(dp, u)
waveforms = wvf(dp, u, n_waveforms=1000, t_waveforms=90)
peak_chan = get_peak_chan(dp,u)
w=waves[:,:,peak_chan]
waveforms = wvf(dp, u, periods=[(0,100),(300,400)])
fs=meta['highpass']['sampling_rate']
t=trn(dp,u)/fs
u_ids = ids(dp,u)
ids=ids(dp,u)[(t>900)&(t<1000)]
mask = (t<100)|((t>300)&(t<400))
waves = wvf(dp, u, spike_ids=u_ids[mask])
temp = templates(dp,u)
Compute auto/crosscorrelogram between 2 units
from npyx.corr import ccg, ccg_stack
c = ccg(dp, [234,92], cbin=0.2, cwin=80)
c = ccg(dp, [234,92], cbin=0.2, cwin=80, periods=[(0,60), (120,180)])
source_units = [1,2,3,4,5]
target_units = [6,7,8,9,10]
c_stack = ccg_stack(dp, source_units, target_units, 0.2, 80, name='my_relevant_ccg_stack')
c_stack = ccg_stack(dp, name='my_relevant_ccg_stack')
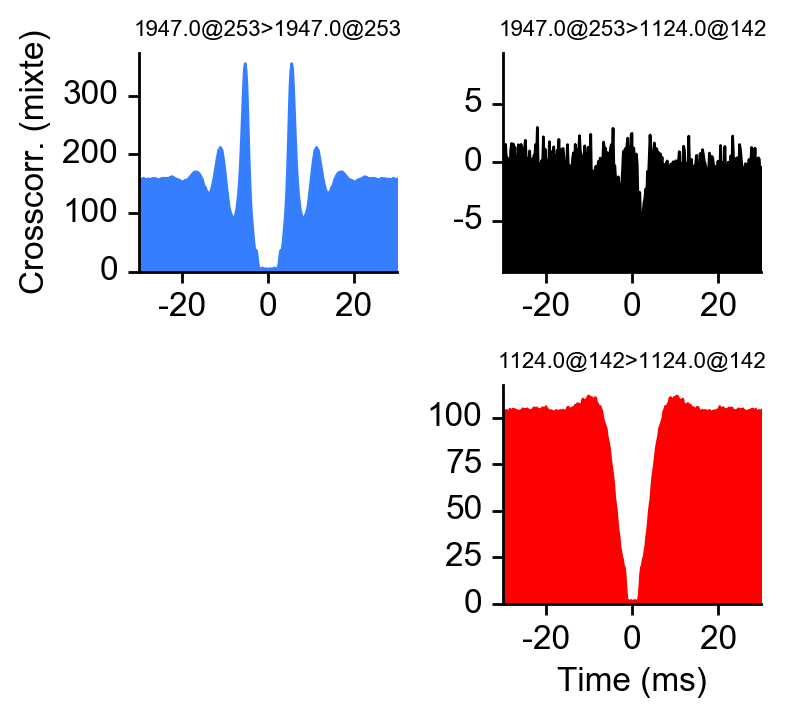
Plot waveform and crosscorrelogram of unit u
from npyx.plot import plot_wvf, get_peak_chan
u=234
fig = plot_wvf(dp, u, Nchannels=16, t_waveforms=2.8)
peakchannel = get_peak_chan(dp, u)
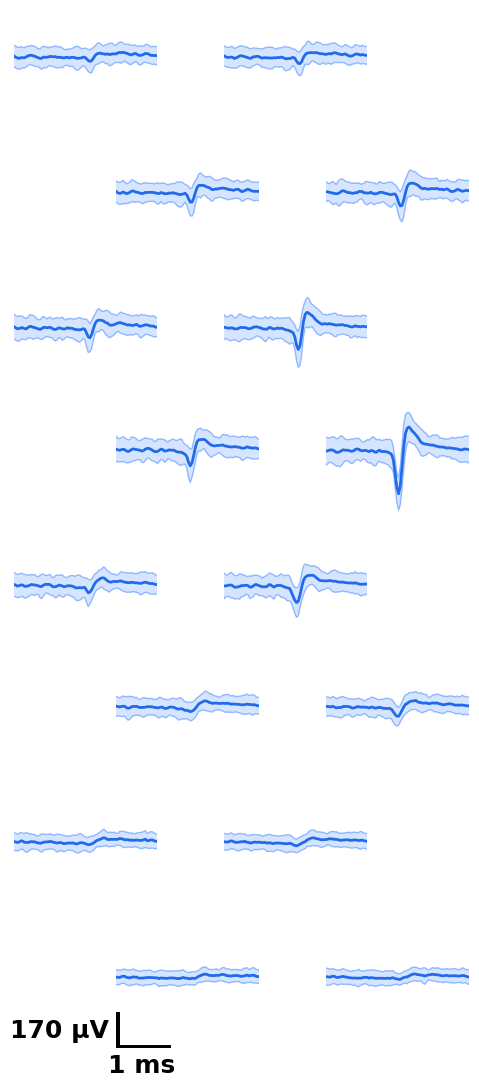
fig = plot_ccg(dp, [u,92], cbin=0.2, cwin=80, as_grid=True)
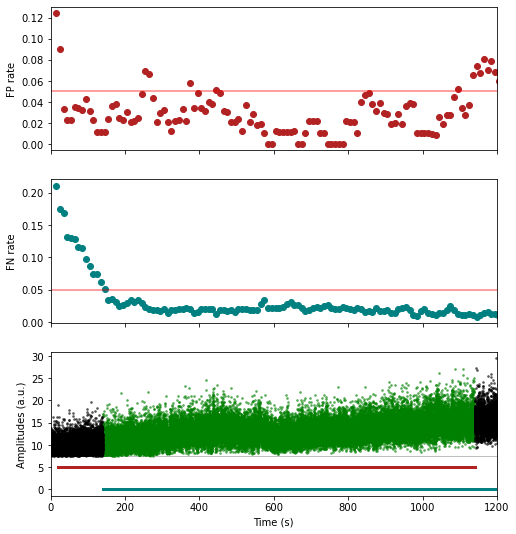
Preprocess your waveforms (drift-shift-matching) and spike trains (detect periods with few false positive/negative)
from npyx.spk_wvf import wvf_dsmatch
from npyx.spk_t import trn_filtered
w_preprocessed = wvf_dsmatch(dp, u, plot_debug=True)
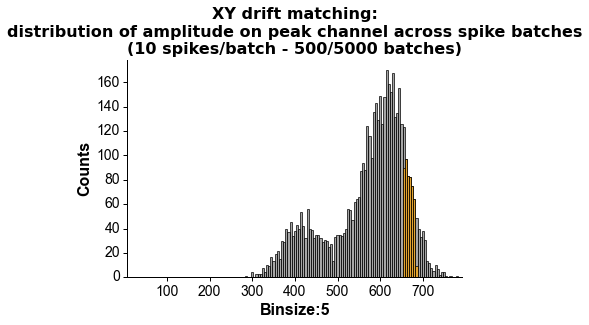
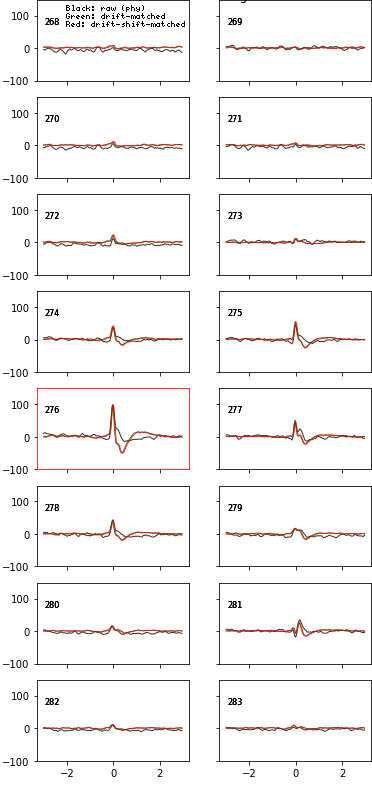
t_preprocessed = trn_filtered(dp, u, plot_debug=True)
Plot chunk of raw data with overlaid units
units = [1,2,3,4,5,6]
channels = np.arange(70,250)
plot_raw_units(dp, times=[0,0.130], units = units, channels = channels,
colors=['orange', 'red', 'limegreen', 'darkgreen', 'cyan', 'navy'],
lw=1.5, offset=450, figsize=(6,16), Nchan_plot=10,
med_sub=1, whiten=1, hpfilt=1)

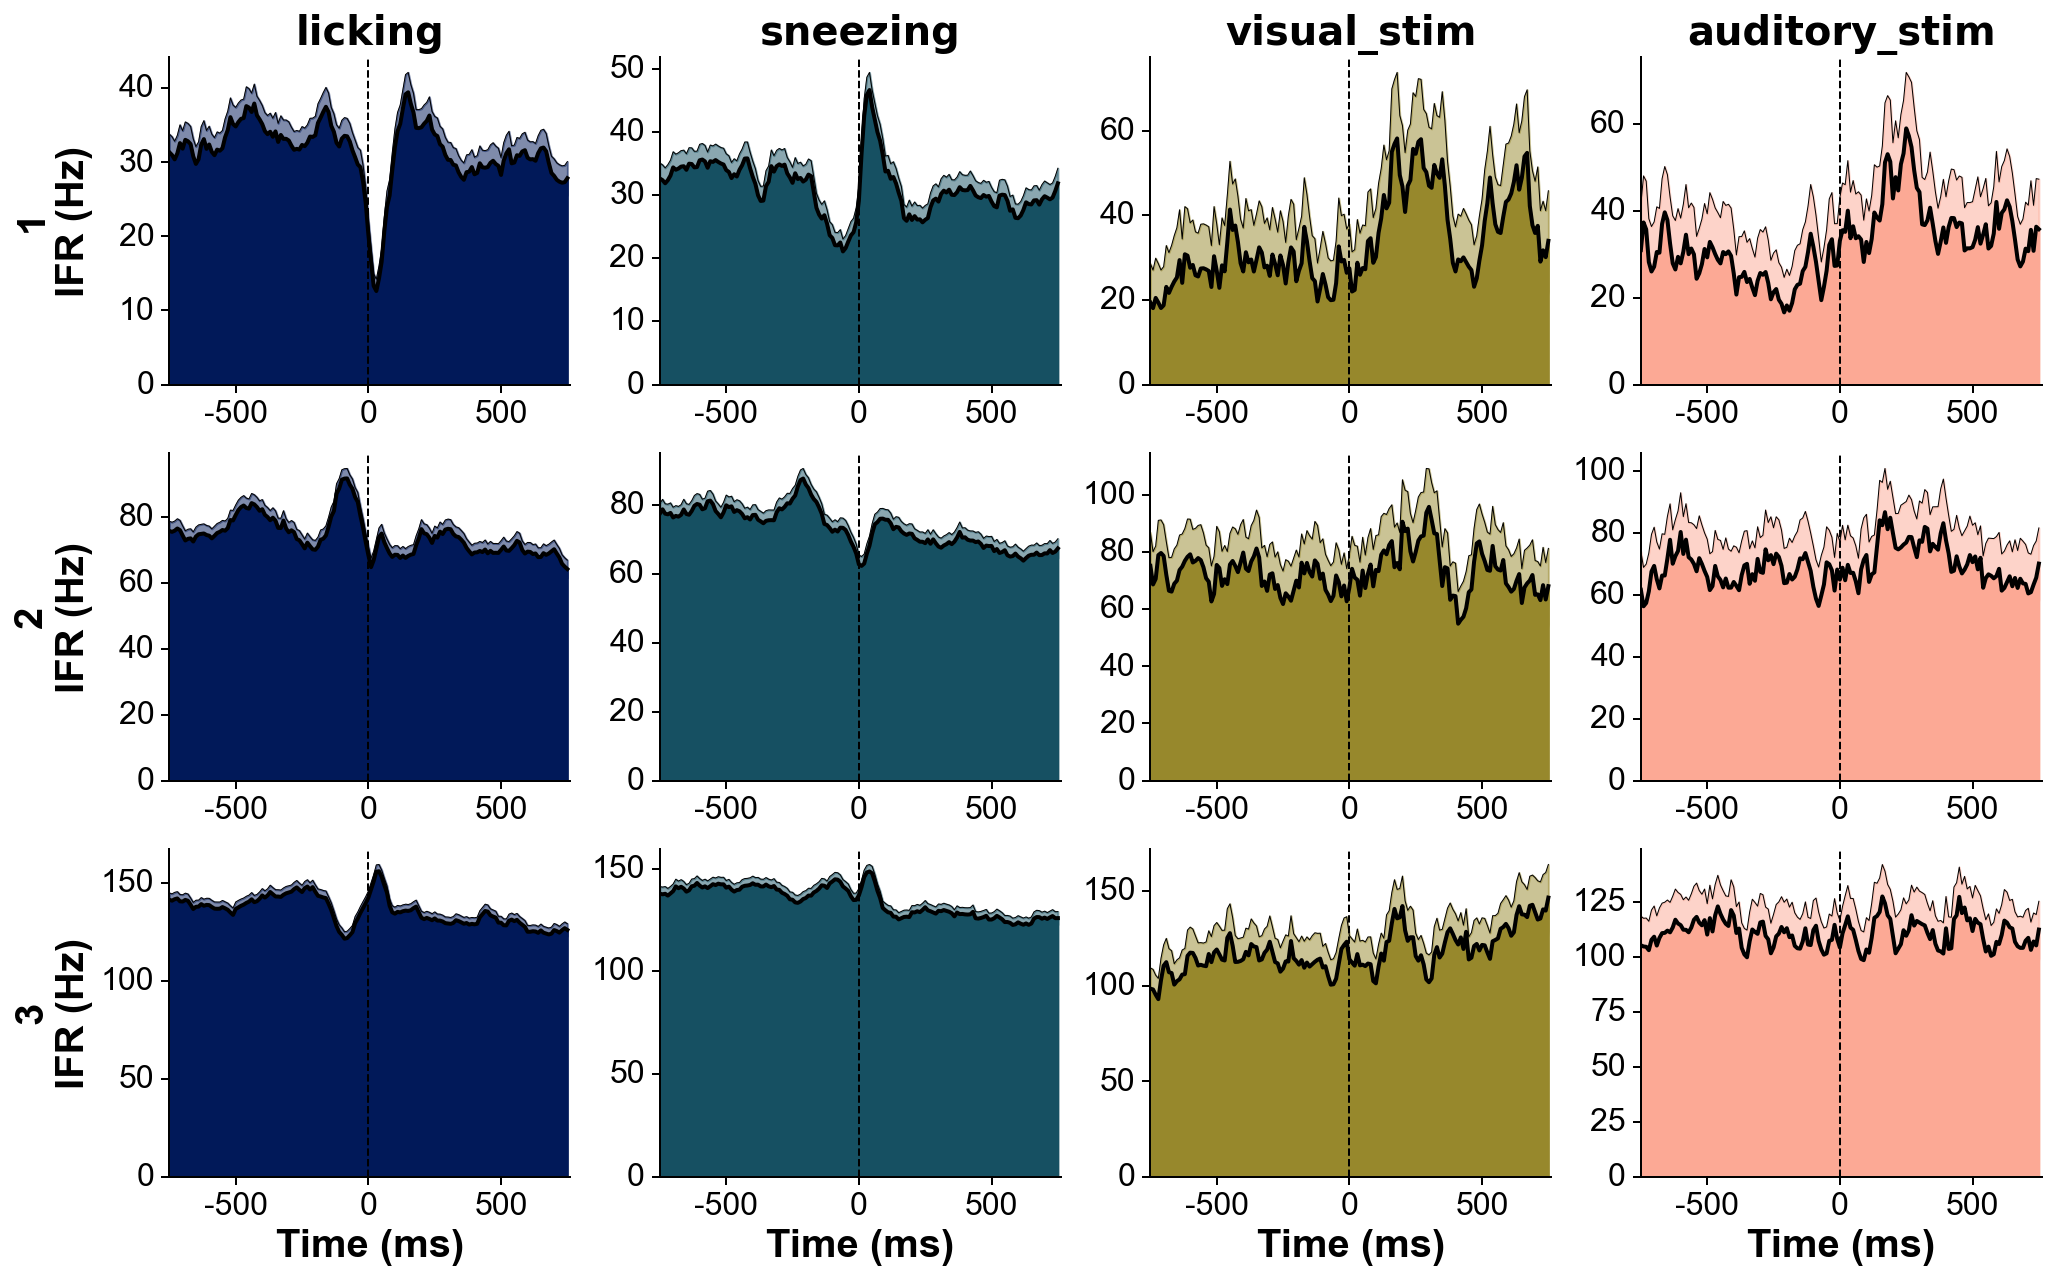
Plot peri-stimulus time histograms across neurons and conditions
fs=30000
units=[1,2,3]
trains=[trn(dp,u)/fs for u in units]
trains_str=units
events=[licks, sneezes, visual_stimuli, auditory_stimuli]
events_str=['licking', 'sneezing', 'visual_stim', 'auditory_stim']
events_col='batlow'
fig=summary_psth(trains, trains_str, events, events_str, psthb=10, psthw=[-750,750],
zscore=0, bsl_subtract=False, bsl_window=[-3000,-750], convolve=True, gsd=2,
events_toplot=[0], events_col=events_col, trains_col_groups=trains_col_groups,
title=None, saveFig=0, saveDir='~/Downloads', _format='pdf',
figh=None, figratio=None, transpose=1,
as_heatmap=False, vmin=None, center=None, vmax=None, cmap_str=None)
Merge datasets acquired on two probes simultaneously
from npyx.merger import merge_datasets
dps = ['same_folder/lateralprobe_dataset',
'same_folder/medialprobe_dataset',
'same_folder/anteriorprobe_dataset']
probenames = ['lateral','medial','anterior']
dp_dict = {p:dp for p, dp in zip(probenames, dps)}
dp_merged, datasets_table = merge_datasets(dp_dict)
--- Merged data (from 2 dataset(s)) will be saved here: /same_folder/merged_lateralprobe_dataset_medialprobe_dataset_anteriorprobe_dataset.
--- Loading spike trains of 2 datasets...
sync channel extraction directory found: /same_folder/lateralprobe_dataset/sync_chan
Data found on sync channels:
chan 2 (201 events).
chan 4 (16 events).
chan 5 (175 events).
chan 6 (28447 events).
chan 7 (93609 events).
Which channel shall be used to synchronize probes? >>> 7
sync channel extraction directory found: /same_folder/medialprobe_dataset/sync_chan
Data found on sync channels:
chan 2 (201 events).
chan 4 (16 events).
chan 5 (175 events).
chan 6 (28447 events).
chan 7 (93609 events).
Which channel shall be used to synchronize probes? >>> 7
sync channel extraction directory found: /same_folder/anteriorprobe_dataset/sync_chan
Data found on sync channels:
chan 2 (201 events).
chan 4 (16 events).
chan 5 (175 events).
chan 6 (28194 events).
chan 7 (93609 events).
Which channel shall be used to synchronize probes? >>> 7
--- Aligning spike trains of 2 datasets...
More than 50 sync signals found - for performance reasons, sub-sampling to 50 homogenoeously spaced sync signals to align data.
50 sync events used for alignement - start-end drift of -3080.633ms
--- Merged spike_times and spike_clusters saved at /same_folder/merged_lateralprobe_dataset_medialprobe_dataset_anteriorprobe_dataset.
--> Merge successful! Use a float u.x in any npyx function to call unit u from dataset x:
- u.0 for dataset lateralprobe_dataset,
- u.1 for dataset medialprobe_dataset,
- u.2 for dataset anteriorprobe_dataset.
Now any npyx function runs on the merged dataset!
Under the hood, it will create a merged_dataset_dataset1_dataset2/npyxMemory folder to save any data computed across dataframes, but will use the original dataset1/npyxMemory folder to save data related to this dataset exclusively (e.g. waveforms). Hence, there is no redundancy: space and time are saved.
This is also why it is primordial that you do not move your datatasets from their original paths after merging them - else, functions ran on merged_dataset1_dataset2 will not know where to go fetch the data! They refer to the paths in merged_dataset_dataset1_dataset2/datasets_table.csv. If you really need to, you can move your datasets but do not forget to edit this file accordingly.
t = trn(dp_merged, 92.1)
fig=plot_ccg(dp_merged,[10.0, 92.1, cbin=0.2, cwin=80])
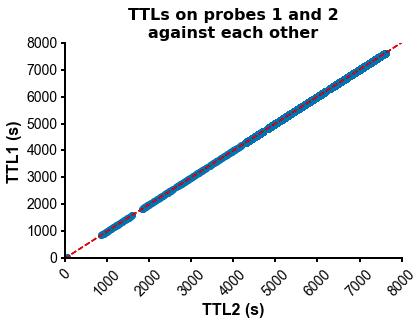
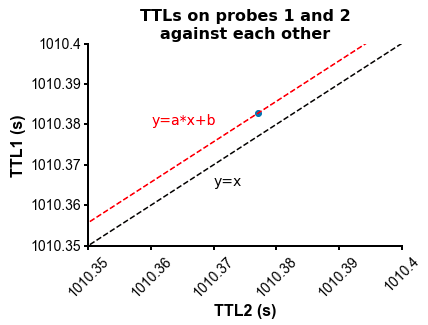
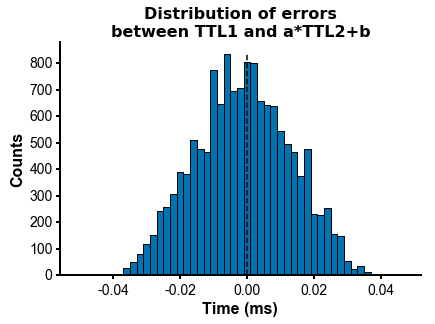
PS - The spike times are aligned across datasets by modelling the drift between the clocks of the neuropixels headstages linearly: TTL probe 1 = a * TTL probe 1 + b (if a!=1, there is drift between the clocks), so spiketimes_probe2_aligned_to_probe1 = a * spiketimes_probe2 + b
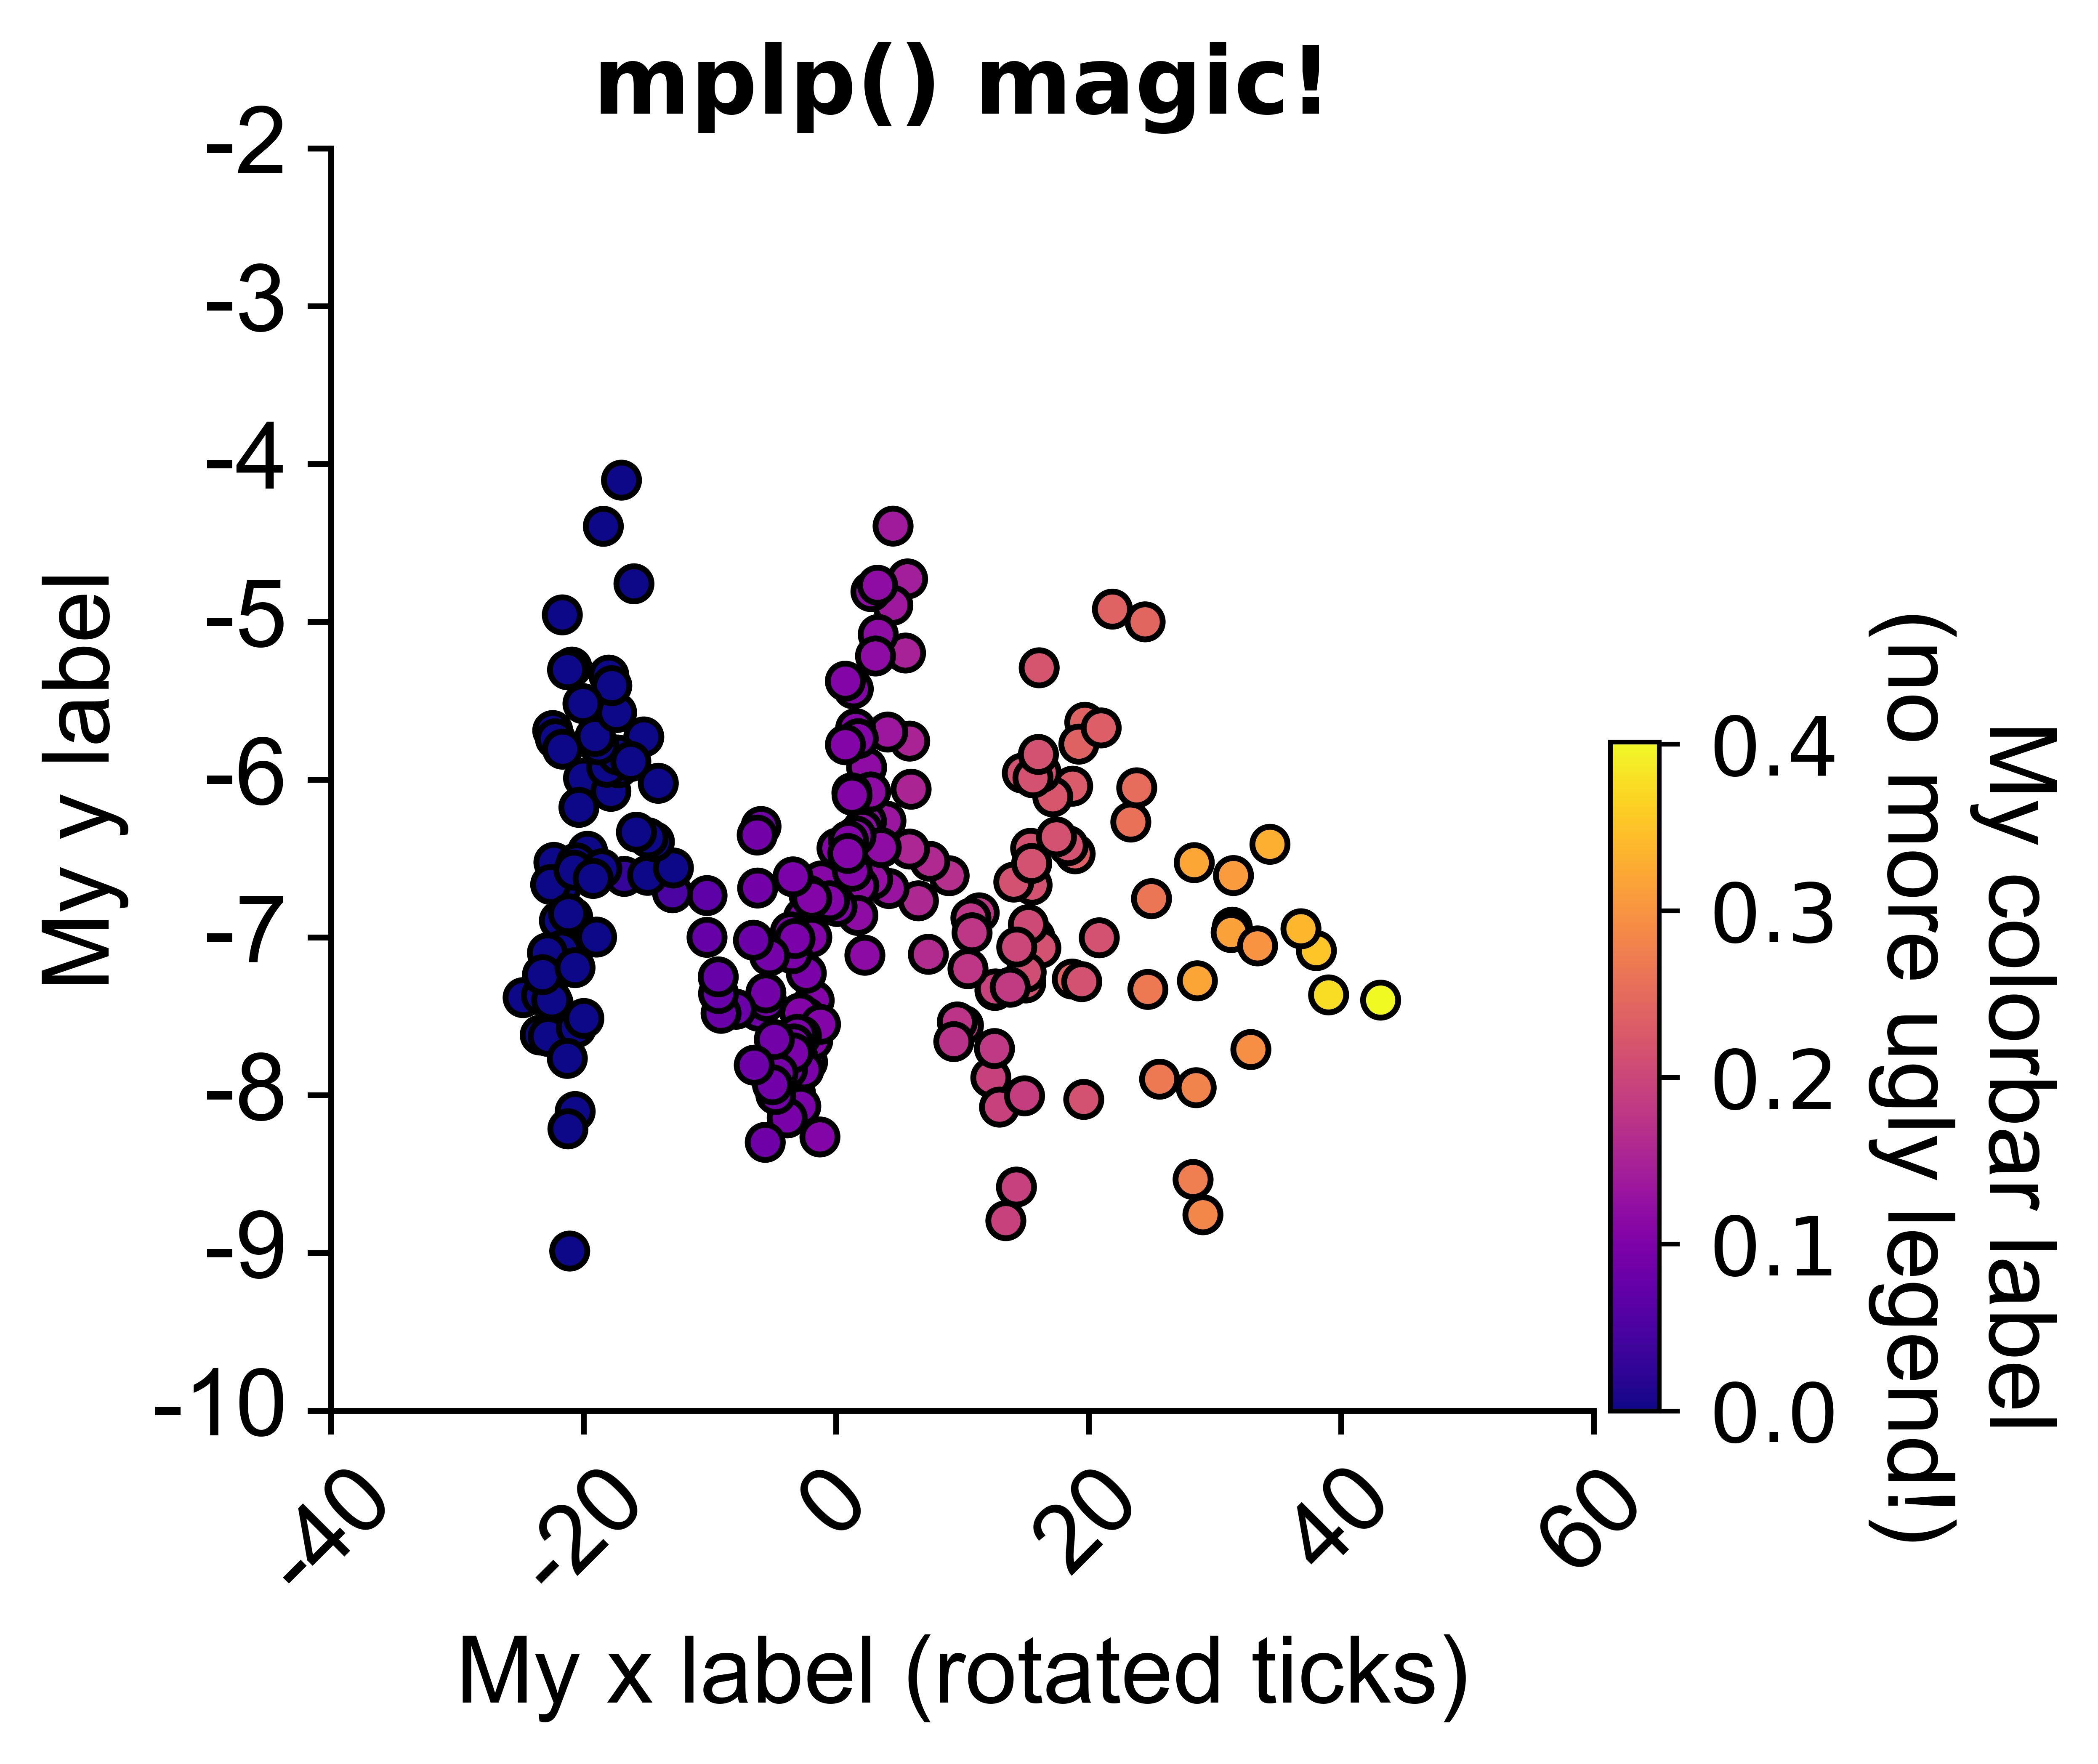
⭐ Bonus: matplotlib plot prettifier
from npyx.plot import get_ncolors_cmap
colors = get_ncolors_cmap('coolwarm', 10, plot=1)
colors = get_ncolors_cmap('viridis', 10, plot=1)

from npyx.plot import mplp
import matplotlib.pyplot as plt
df1 = pd.load("my_dataframe.csv")
fig = plt.figure()
sns.scatterplot(data=df1,
x='popsync', y='depth', hue='mean_popsync',
palette='plasma', alpha=1, linewidth=1, edgecolor='black')
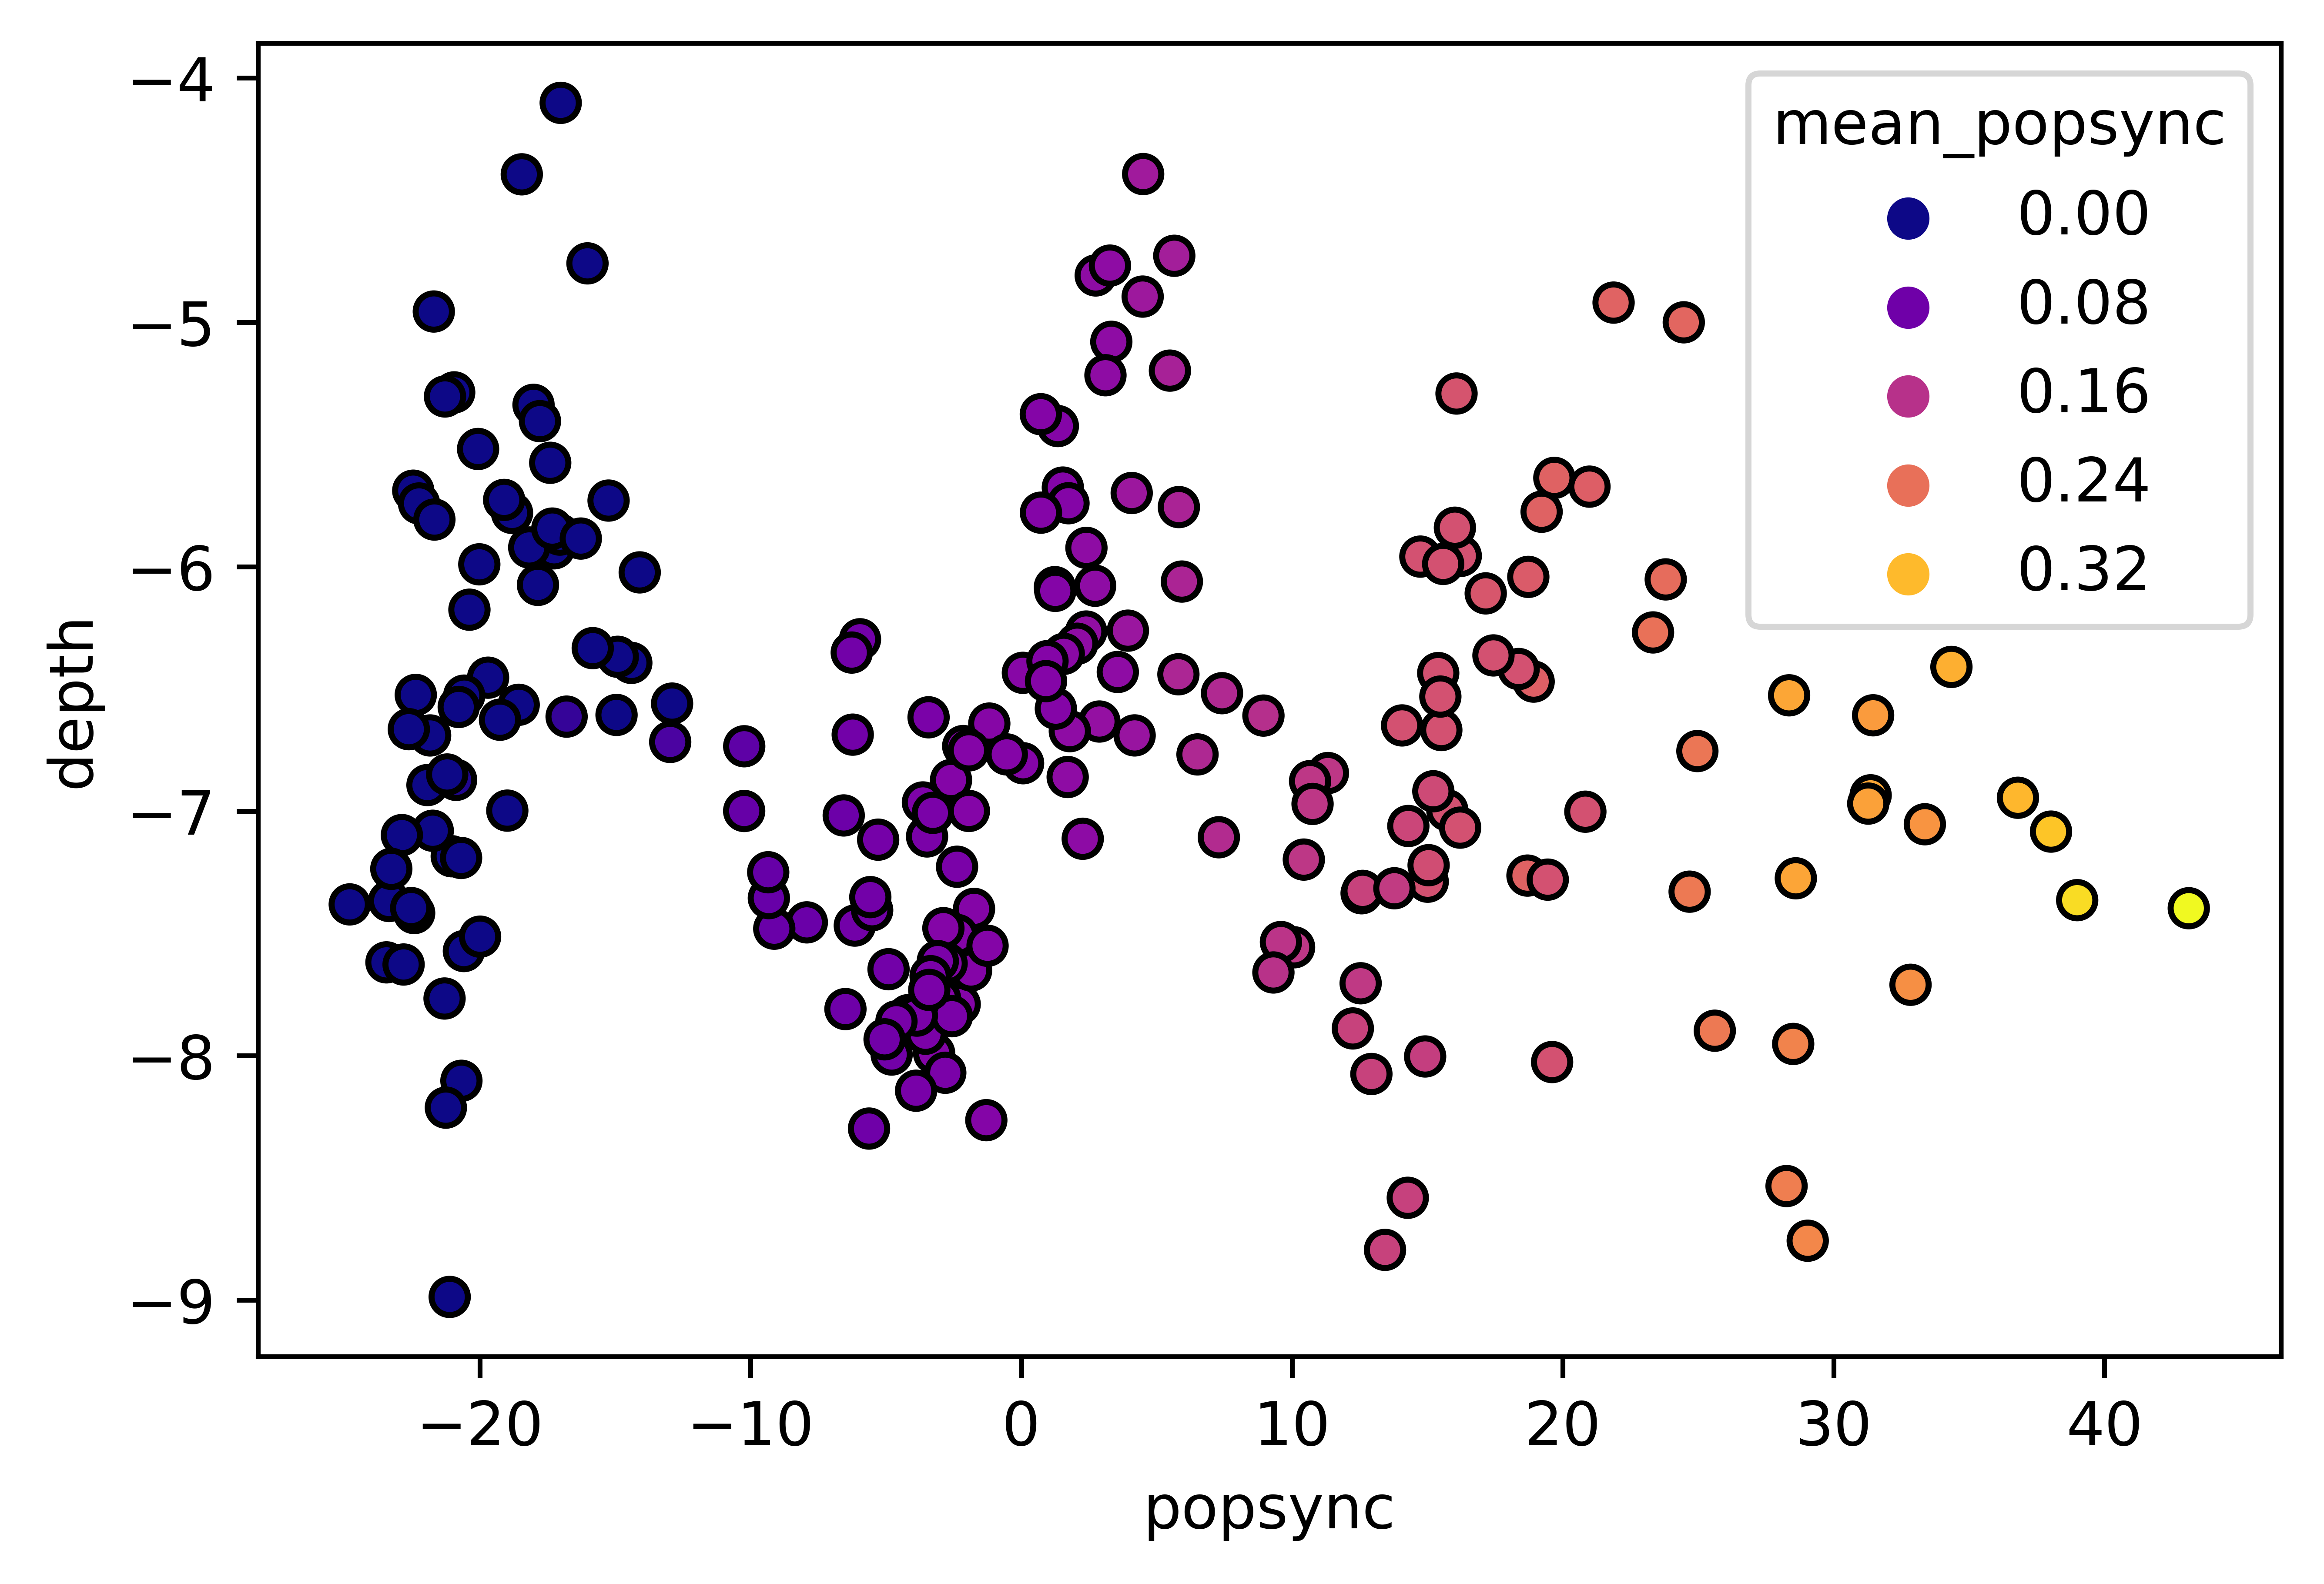
fig = plt.figure()
sns.scatterplot(data=df1,
x='popsync', y='depth', hue='mean_popsync',
palette='plasma', alpha=1, linewidth=1, edgecolor='black')
mplp(figsize=(3,3), title="My title", ylim=[-10,-2], xlim=[-40,60],
xlabel = "My x label (rotated ticks)", ylabel="My y label",
xtickrot=45,
hide_legend=True, colorbar=True,
vmin=df['mean_popsync'].min(), vmax=df['mean_popsync'].max(),
cbar_w=0.03, cbar_h=0.4, clabel="My colorbar label\n(no more ugly legend!)", cmap="plasma",
clabel_s=16, cticks_s=14, ticklab_s=16,
saveFig=saveFig, saveDir=saveDir, figname = f"popsync_{pair}")
