

Product
Socket for Jira Is Now Available
Socket for Jira lets teams turn alerts into Jira tickets with manual creation, automated ticketing rules, and two-way sync.
By Jeppe Hasseriis - Apr 20, 2026
node-image-chart-js
Advanced tools
![]()


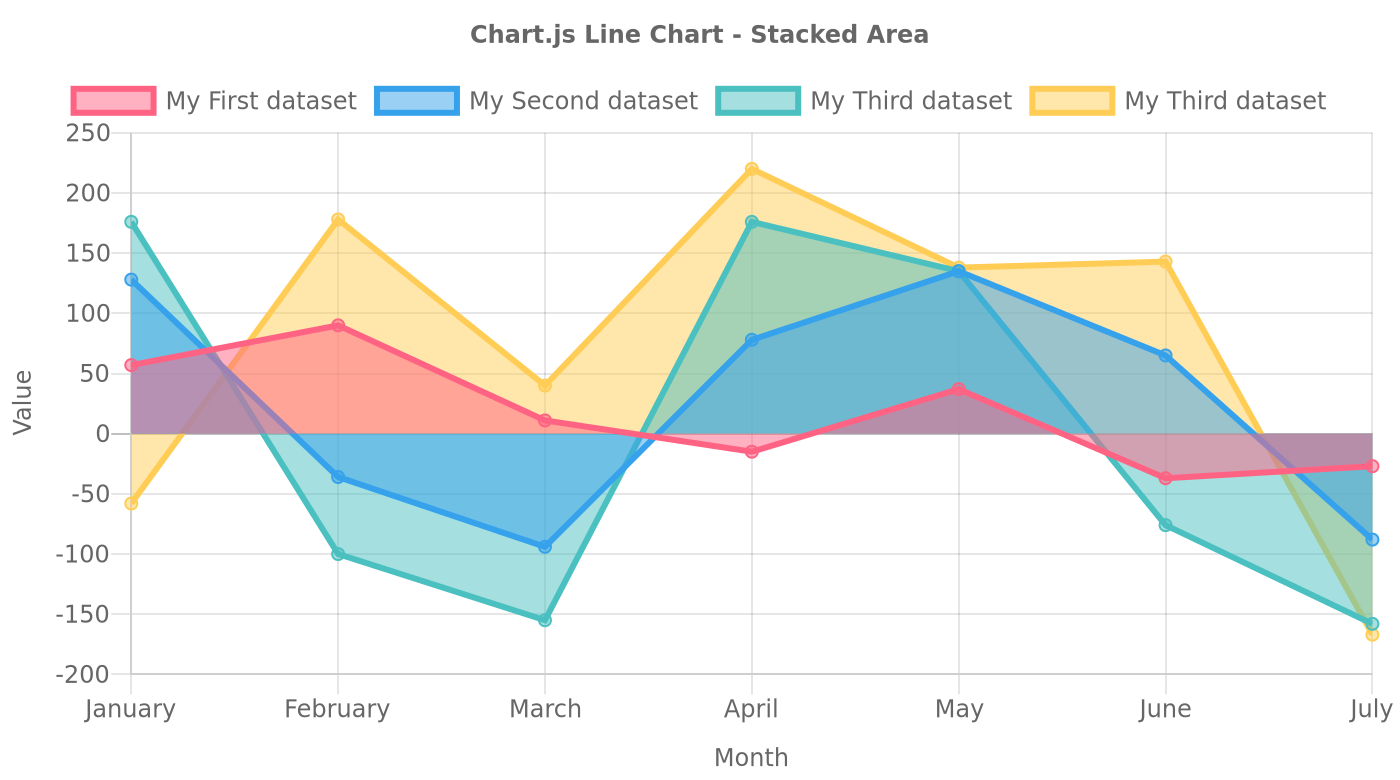
Generate Chart.JS charts as image and embed them everywhere in emails, pdf reports, chat bots...!
npm install chart.js-image --save
CommonJS
const ChartJSImage = require('chart.js-image');
ES6
import ChartJSImage from 'chart.js-image';
const line_chart = ChartJSImage().chart({
  "type": "line",
  "data": {
    "labels": [
      "January",
      "February",
      "March",
      "April",
      "May",
      "June",
      "July"
    ],
    "datasets": [
      {
        "label": "My First dataset",
        "borderColor": "rgb(255,+99,+132)",
        "backgroundColor": "rgba(255,+99,+132,+.5)",
        "data": [
          57,
          90,
          11,
          -15,
          37,
          -37,
          -27
        ]
      },
      {
        "label": "My Second dataset",
        "borderColor": "rgb(54,+162,+235)",
        "backgroundColor": "rgba(54,+162,+235,+.5)",
        "data": [
          71,
          -36,
          -94,
          78,
          98,
          65,
          -61
        ]
      },
      {
        "label": "My Third dataset",
        "borderColor": "rgb(75,+192,+192)",
        "backgroundColor": "rgba(75,+192,+192,+.5)",
        "data": [
          48,
          -64,
          -61,
          98,
          0,
          -39,
          -70
        ]
      },
      {
        "label": "My Fourth dataset",
        "borderColor": "rgb(255,+205,+86)",
        "backgroundColor": "rgba(255,+205,+86,+.5)",
        "data": [
          -58,
          88,
          29,
          44,
          3,
          78,
          -9
        ]
      }
    ]
  },
  "options": {
    "title": {
      "display": true,
      "text": "Chart.js Line Chart"
    },
    "scales": {
      "xAxes": [
        {
          "scaleLabel": {
            "display": true,
            "labelString": "Month"
          }
        }
      ],
      "yAxes": [
        {
          "stacked": true,
          "scaleLabel": {
            "display": true,
            "labelString": "Value"
          }
        }
      ]
    }
  }
}) // Line chart
.backgroundColor('white')
.width(500) // 500px
.height(300); // 300px

line_chart.toURL(); // String: https://image-charts.com/chart.js/2.8.0?icac=documentation&chart=%7Btype%3A%27line%27%2Cdata%3A%7Blabels%3A%5B%27January%27%2C%27February%27%2C%27March%27%2C%27April%27%2C%27May%27%2C%27June%27%2C%27July%27%5D%2Cdatasets%3A%5B%7Blabel%3A%27My+First+dataset%27%2CborderColor%3A%27rgb%28255%2C+99%2C+132%29%27%2CbackgroundColor%3A%27rgba%28255%2C+99%2C+132%2C+.5%29%27%2Cdata%3A%5B57%2C90%2C11%2C-15%2C37%2C-37%2C-27%5D%7D%2C%7Blabel%3A%27My+Second+dataset%27%2CborderColor%3A%27rgb%2854%2C+162%2C+235%29%27%2CbackgroundColor%3A%27rgba%2854%2C+162%2C+235%2C+.5%29%27%2Cdata%3A%5B71%2C-36%2C-94%2C78%2C98%2C65%2C-61%5D%7D%2C%7Blabel%3A%27My+Third+dataset%27%2CborderColor%3A%27rgb%2875%2C+192%2C+192%29%27%2CbackgroundColor%3A%27rgba%2875%2C+192%2C+192%2C+.5%29%27%2Cdata%3A%5B48%2C-64%2C-61%2C98%2C0%2C-39%2C-70%5D%7D%2C%7Blabel%3A%27My+Third+dataset%27%2CborderColor%3A%27rgb%28255%2C+205%2C+86%29%27%2CbackgroundColor%3A%27rgba%28255%2C+205%2C+86%2C+.5%29%27%2Cdata%3A%5B-58%2C88%2C29%2C44%2C3%2C78%2C-9%5D%7D%5D%7D%2Coptions%3A%7Bresponsive%3Atrue%2Ctitle%3A%7Bdisplay%3Atrue%2Ctext%3A%27Chart.js+Line+Chart+-+Stacked+Area%27%7D%2Ctooltips%3A%7Bmode%3A%27index%27%7D%2Chover%3A%7Bmode%3A%27index%27%7D%2Cscales%3A%7BxAxes%3A%5B%7BscaleLabel%3A%7Bdisplay%3Atrue%2ClabelString%3A%27Month%27%7D%7D%5D%2CyAxes%3A%5B%7Bstacked%3Atrue%2CscaleLabel%3A%7Bdisplay%3Atrue%2ClabelString%3A%27Value%27%7D%7D%5D%7D%7D%7D&bkg=white&width=700&height=390&icretina=1&ichm=922e17b749b1ab7fab2a14cb742029dc46e50e658457913a9f548793910d2a0d
line_chart.toFile('/path/to/chart.png'); // Promise<()>
line_chart.toDataURI(); // Promise<String> : data:image/png;base64,iVBORw0KGgo...
line_chart.toBuffer(); // Promise<Buffer> : Buffer 89 50 4e 47 0d 0a 1a 0a 00 00 00 ...
account_idCreate an instance, the argument within [ ] is optional. See usage
ChartJSImage( [ Object opt ] )
// or
new ChartJSImage( [ Object opt ] )
Default options are listed below.
opt = {
    /*
     * Request timeout (in millisecond) when calling toBuffer() or toDataURI()
     */
    timeout: 5000,

    /*
     * (Enterprise and Enterprise+ subscription only) SECRET_KEY
     */
    secret: null,

    /*
     * (Enterprise, Enterprise+ and On-Premise subscription only) custom domain
     */
    host: 'image-charts.com',

    /*
     * (On-Premise subscription only) custom protocol
     */
    protocol: 'https',

    /*
     * (On-Premise subscription only) custom port
     */
    port: 443,

    /*
     * (On-Premise subscription only) custom pathname
     */
    pathname: '/chart.js/2.8.0'
}
toURL() : StringGet the full Image-Charts API url (signed and encoded if necessary)
// import ChartJSImage from 'chart.js-image';
const ChartJSImage = require('..');

const chart_url = ChartJSImage()
.chart({
type: 'bar',
data: { labels: ['Hello world', 'Foo bar'], datasets: [{ label: 'Foo', data: [1, 2] }] },
}) // vertical bar chart
.width(300) // 300px
.height(300) // 300px
.toURL(); // get the generated URL

console.log(chart_url); // https://image-charts.com/chart?cht=bvg&chs=300x300&chd=a%3A60%2C40
toFile(file) : Promise<()>Creates a file containing generated chart image and yield a promise.
When
fileis a filename, asynchronously writes data to the file, replacing the file if it already exists. Whenfileis a file descriptor, the behavior is similar to calling fs.write() directly (which is recommended).
//import ChartJSImage from 'chart.js-image';
const ChartJSImage = require('..');

const chart_path = '/tmp/chart.png';

ChartJSImage()
.chart({
  "type": "radar",
  "data": {
    "labels": [
      "January",
      "February",
      "March",
      "April",
      "May",
      "June",
      "July",
      "August"
    ],
    "datasets": [
      {
        "backgroundColor": "rgba(255, 99, 132, 0.5)",
        "borderColor": "rgb(255, 99, 132)",
        "data": [
          15.09,
          15.67,
          12.5,
          12.77,
          13.62,
          13.68,
          13.93,
          15.95
        ],
        "label": "D0"
      },
      {
        "backgroundColor": "rgba(255, 159, 64, 0.5)",
        "borderColor": "rgb(255, 159, 64)",
        "data": [
          24.55,
          28.91,
          21.81,
          23.27,
          26.98,
          26.05,
          25.39,
          24.92
        ],
        "label": "D1",
        "fill": "-1"
      },
      {
        "backgroundColor": "rgba(255, 205, 86, 0.5)",
        "borderColor": "rgb(255, 205, 86)",
        "data": [
          36.35,
          43.93,
          32.54,
          33.54,
          42.82,
          39.34,
          35.84,
          33.5
        ],
        "label": "D2",
        "fill": 1
      },
      {
        "backgroundColor": "rgba(75, 192, 192, 0.5)",
        "borderColor": "rgb(75, 192, 192)",
        "data": [
          47.7,
          58.92,
          44.45,
          49.08,
          53.39,
          51.85,
          48.4,
          49.36
        ],
        "label": "D3",
        "fill": false
      },
      {
        "backgroundColor": "rgba(54, 162, 235, 0.5)",
        "borderColor": "rgb(54, 162, 235)",
        "data": [
          60.73,
          71.97,
          53.96,
          57.22,
          65.09,
          62.06,
          56.91,
          60.52
        ],
        "label": "D4",
        "fill": "-1"
      },
      {
        "backgroundColor": "rgba(153, 102, 255, 0.5)",
        "borderColor": "rgb(153, 102, 255)",
        "data": [
          73.33,
          80.78,
          68.05,
          68.59,
          76.79,
          77.24,
          66.08,
          72.37
        ],
        "label": "D5",
        "fill": "-1"
      }
    ]
  },
  "options": {
    "maintainAspectRatio": true,
    "spanGaps": false,
    "elements": {
      "line": {
        "tension": 0.000001
      }
    },
    "plugins": {
      "filler": {
        "propagate": false
      },
      "samples-filler-analyser": {
        "target": "chart-analyser"
      }
    }
  }
})
.bkg('white')
.width(700)
.height(390)
.toFile(chart_path)
.then(() => console.log('Image chart written at %s', chart_path))
toBuffer() : Promise<Buffer>Do a request to Image-Charts API with current configuration and yield a promise of a NodeJS buffer
//import ChartJSImage from 'chart.js-image';
const ChartJSImage = require('..');

const buffer = ChartJSImage()
.chart({
  "type": "radar",
  "data": {
    "labels": [
      "January",
      "February",
      "March",
      "April",
      "May",
      "June",
      "July",
      "August"
    ],
    "datasets": [
      {
        "backgroundColor": "rgba(255, 99, 132, 0.5)",
        "borderColor": "rgb(255, 99, 132)",
        "data": [
          15.09,
          15.67,
          12.5,
          12.77,
          13.62,
          13.68,
          13.93,
          15.95
        ],
        "label": "D0"
      },
      {
        "backgroundColor": "rgba(255, 159, 64, 0.5)",
        "borderColor": "rgb(255, 159, 64)",
        "data": [
          24.55,
          28.91,
          21.81,
          23.27,
          26.98,
          26.05,
          25.39,
          24.92
        ],
        "label": "D1",
        "fill": "-1"
      },
      {
        "backgroundColor": "rgba(255, 205, 86, 0.5)",
        "borderColor": "rgb(255, 205, 86)",
        "data": [
          36.35,
          43.93,
          32.54,
          33.54,
          42.82,
          39.34,
          35.84,
          33.5
        ],
        "label": "D2",
        "fill": 1
      },
      {
        "backgroundColor": "rgba(75, 192, 192, 0.5)",
        "borderColor": "rgb(75, 192, 192)",
        "data": [
          47.7,
          58.92,
          44.45,
          49.08,
          53.39,
          51.85,
          48.4,
          49.36
        ],
        "label": "D3",
        "fill": false
      },
      {
        "backgroundColor": "rgba(54, 162, 235, 0.5)",
        "borderColor": "rgb(54, 162, 235)",
        "data": [
          60.73,
          71.97,
          53.96,
          57.22,
          65.09,
          62.06,
          56.91,
          60.52
        ],
        "label": "D4",
        "fill": "-1"
      },
      {
        "backgroundColor": "rgba(153, 102, 255, 0.5)",
        "borderColor": "rgb(153, 102, 255)",
        "data": [
          73.33,
          80.78,
          68.05,
          68.59,
          76.79,
          77.24,
          66.08,
          72.37
        ],
        "label": "D5",
        "fill": "-1"
      }
    ]
  },
  "options": {
    "maintainAspectRatio": true,
    "spanGaps": false,
    "elements": {
      "line": {
        "tension": 0.000001
      }
    },
    "plugins": {
      "filler": {
        "propagate": false
      },
      "samples-filler-analyser": {
        "target": "chart-analyser"
      }
    }
  }
})
.bkg('white')
.width(700)
.height(390)
.toBuffer() // download chart image as a buffer
.then((buffer) => console.log(buffer)) // <Buffer 89 50 4e 47 0d 0a 1a 0a 00 00 00 0d 49 48 44 5
toDataURI() : StringDo a request to Image-Charts API with current configuration and yield a promise of a base64 encoded data URI
//import ChartJSImage from 'chart.js-image';
const ChartJSImage = require('..');

const chart_url = ChartJSImage()
.chart({
  "type": "radar",
  "data": {
    "labels": [
      "January",
      "February",
      "March",
      "April",
      "May",
      "June",
      "July",
      "August"
    ],
    "datasets": [
      {
        "backgroundColor": "rgba(255, 99, 132, 0.5)",
        "borderColor": "rgb(255, 99, 132)",
        "data": [
          15.09,
          15.67,
          12.5,
          12.77,
          13.62,
          13.68,
          13.93,
          15.95
        ],
        "label": "D0"
      },
      {
        "backgroundColor": "rgba(255, 159, 64, 0.5)",
        "borderColor": "rgb(255, 159, 64)",
        "data": [
          24.55,
          28.91,
          21.81,
          23.27,
          26.98,
          26.05,
          25.39,
          24.92
        ],
        "label": "D1",
        "fill": "-1"
      },
      {
        "backgroundColor": "rgba(255, 205, 86, 0.5)",
        "borderColor": "rgb(255, 205, 86)",
        "data": [
          36.35,
          43.93,
          32.54,
          33.54,
          42.82,
          39.34,
          35.84,
          33.5
        ],
        "label": "D2",
        "fill": 1
      },
      {
        "backgroundColor": "rgba(75, 192, 192, 0.5)",
        "borderColor": "rgb(75, 192, 192)",
        "data": [
          47.7,
          58.92,
          44.45,
          49.08,
          53.39,
          51.85,
          48.4,
          49.36
        ],
        "label": "D3",
        "fill": false
      },
      {
        "backgroundColor": "rgba(54, 162, 235, 0.5)",
        "borderColor": "rgb(54, 162, 235)",
        "data": [
          60.73,
          71.97,
          53.96,
          57.22,
          65.09,
          62.06,
          56.91,
          60.52
        ],
        "label": "D4",
        "fill": "-1"
      },
      {
        "backgroundColor": "rgba(153, 102, 255, 0.5)",
        "borderColor": "rgb(153, 102, 255)",
        "data": [
          73.33,
          80.78,
          68.05,
          68.59,
          76.79,
          77.24,
          66.08,
          72.37
        ],
        "label": "D5",
        "fill": "-1"
      }
    ]
  },
  "options": {
    "maintainAspectRatio": true,
    "spanGaps": false,
    "elements": {
      "line": {
        "tension": 0.000001
      }
    },
    "plugins": {
      "filler": {
        "propagate": false
      },
      "samples-filler-analyser": {
        "target": "chart-analyser"
      }
    }
  }
})
.bkg('white')
.width(700)
.height(390)
.toDataURI() // download chart image and generate a data URI string
.then(chart_url => console.log(chart_url)); // "data:image/png;base64,iVBORw0KGgoAAAANSUhE"UgAABXgAAAMMCAIAAABmCliNAAHJnElEQVR42uzdeXjc1X3v8e/sq8baF2uXvMkbBmxibMALmN0FGiCBJpT0Ccnl0qRNnockT3vbOuT2Xkpzcxty0yZtnoQCqdliCKaktpEBG2+xkRfJlmzZsiXLlrWPRpp9u38c+DEZybYsy/KM9H794Uf6+aefRufMdj5zzvfo4vG4AAAAAAAAjAc9TQAAAAAAAMYLQQMAAAAAABPhyJEjf/RHf+T1elPkF12h20PQAAAAAADARCgvL1+3bp3Vap3cf6aRngYAAAAAYAK0trauW7fub/7mb37wgx8kHs/KynruuecKCgreeOONF198UR187bXXduzY8eMf/1j79p133lH/u27duuuuuy7p4q+//vpLL70kIn/7t39rt9tF5JFHHjnflVtbW7/zne988YtfVKd9//vfr6ysfPzxx2OxmDpBpSGJ11y8eLF2ERWXfO973xvxryBoAAAAAABgon3ve9/r6ur65S9/+Vd/9Vfnzp174okn1q1b9+KLL2rHjxw58uMf//hrX/taJBJR37744ot/+Zd/2d3dvW7dutdeey3xai0tLS+99JL62WeeeWbdunXarxjxyuvWrfve975nMBjUaaFQ6LHHHvvLv/xLm81msVjMZrNaWJF0Te0i69atS/wViX/Fa6+9RtAAAAAAAMBEu+aaa1pbW0Vk0aJFLS0tw48rc+bMCYVC2rf/9E//VFpa+vOf/9xisdx3333a8WeffVb9rMFgmD9/fjAYHH6p8317zTXX6HS6u+6665/+6Z8qKyu1ORTaaaO5ZuJfQdAAAAAAAEB6WLduXWZmZlFRkRYuJLFYLCUlJYnJxWjY7fYnn3xy5cqVp06d2r1799KlSy/nmhSDBAAAAAAgVRw8ePDYsWPat01NTYnfBgIBt9tdV1cXi8XmJtB+9re//e3DDz8cCAQueuXE4x0dHXV1dX6/PxgM/q//9b96enrq6uqi0ejwa57vIomY0QAAAAAAwNU3d+7ct99++/7771cVGdW3Tz755JkzZ4b/r1avMelny8vL33777SNHjl
Image-Charts Enterprise and Enterprise+ subscriptions remove the watermark and enable advanced features like custom-domain, high-resolution charts, custom fonts, multiple axis and mixed charts.
Once subscribed to a plan you will receive an ACCOUNT_ID and a SECRET_KEY.
These two parameters are mandatory to sign your request and remove the watermark.
Replace both values in the code example below:
//import ChartJSImage from 'chart.js-image';
const ChartJSImage = require('..');

const chart_url = ChartJSImage({secret: process.env.SECRET_KEY ||  'SECRET_KEY'})
.icac(process.env.ACCOUNT_ID || 'ACCOUNT_ID')
.chart({
  type: 'line',
  data: {
    labels: ['January', 'February', 'March', 'April', 'May', 'June', 'July'],
    datasets: [
      {
        label: 'My First dataset',
        borderColor: 'rgb(255, 99, 132)',
        backgroundColor: 'rgba(255, 99, 132, .5)',
        data: [57, 90, 11, -15, 37, -37, -27],
      },
      {
        label: 'My Second dataset',
        borderColor: 'rgb(54, 162, 235)',
        backgroundColor: 'rgba(54, 162, 235, .5)',
        data: [71, -36, -94, 78, 98, 65, -61],
      },
      {
        label: 'My Third dataset',
        borderColor: 'rgb(75, 192, 192)',
        backgroundColor: 'rgba(75, 192, 192, .5)',
        data: [48, -64, -61, 98, 0, -39, -70],
      },
      {
        label: 'My Third dataset',
        borderColor: 'rgb(255, 205, 86)',
        backgroundColor: 'rgba(255, 205, 86, .5)',
        data: [-58, 88, 29, 44, 3, 78, -9],
      },
    ],
  },
  options: {
    responsive: true,
    title: {
      display: true,
      text: 'Chart.js Line Chart - Stacked Area',
    },
    tooltips: {
      mode: 'index',
    },
    hover: {
      mode: 'index',
    },
    scales: {
      xAxes: [
        {
          scaleLabel: {
            display: true,
            labelString: 'Month',
          },
        },
      ],
      yAxes: [
        {
          stacked: true,
          scaleLabel: {
            display: true,
            labelString: 'Value',
          },
        },
      ],
    },
  },
})
.bkg('white')
.width(700)
.height(390)
.icretina('1') // enable paid-only features like high-resolution charts
.toURL(); // get the whole (HMAC signed) URL

console.log(chart_url);
// https://image-charts.com/chart.js/2.8.0?icac=documentation&chart=%7Btype%3A%27line%27%2Cdata%3A%7Blabels%3A%5B%27January%27%2C%27February%27%2C%27March%27%2C%27April%27%2C%27May%27%2C%27June%27%2C%27July%27%5D%2Cdatasets%3A%5B%7Blabel%3A%27My+First+dataset%27%2CborderColor%3A%27rgb%28255%2C+99%2C+132%29%27%2CbackgroundColor%3A%27rgba%28255%2C+99%2C+132%2C+.5%29%27%2Cdata%3A%5B57%2C90%2C11%2C-15%2C37%2C-37%2C-27%5D%7D%2C%7Blabel%3A%27My+Second+dataset%27%2CborderColor%3A%27rgb%2854%2C+162%2C+235%29%27%2CbackgroundColor%3A%27rgba%2854%2C+162%2C+235%2C+.5%29%27%2Cdata%3A%5B71%2C-36%2C-94%2C78%2C98%2C65%2C-61%5D%7D%2C%7Blabel%3A%27My+Third+dataset%27%2CborderColor%3A%27rgb%2875%2C+192%2C+192%29%27%2CbackgroundColor%3A%27rgba%2875%2C+192%2C+192%2C+.5%29%27%2Cdata%3A%5B48%2C-64%2C-61%2C98%2C0%2C-39%2C-70%5D%7D%2C%7Blabel%3A%27My+Third+dataset%27%2CborderColor%3A%27rgb%28255%2C+205%2C+86%29%27%2CbackgroundColor%3A%27rgba%28255%2C+205%2C+86%2C+.5%29%27%2Cdata%3A%5B-58%2C88%2C29%2C44%2C3%2C78%2C-9%5D%7D%5D%7D%2Coptions%3A%7Bresponsive%3Atrue%2Ctitle%3A%7Bdisplay%3Atrue%2Ctext%3A%27Chart.js+Line+Chart+-+Stacked+Area%27%7D%2Ctooltips%3A%7Bmode%3A%27index%27%7D%2Chover%3A%7Bmode%3A%27index%27%7D%2Cscales%3A%7BxAxes%3A%5B%7BscaleLabel%3A%7Bdisplay%3Atrue%2ClabelString%3A%27Month%27%7D%7D%5D%2CyAxes%3A%5B%7Bstacked%3Atrue%2CscaleLabel%3A%7Bdisplay%3Atrue%2ClabelString%3A%27Value%27%7D%7D%5D%7D%7D%7D&bkg=white&width=700&height=390&icretina=1&ichm=922e17b749b1ab7fab2a14cb742029dc46e50e658457913a9f548793910d2a0d
Image-Charts virtual appliance can be deployed anywhere inside a customer network.
import ChartJSImage from 'chart.js-image';

const chart_url = ChartJSImage({
        secret: 'SECRET_KEY',

        // override the host with your own endpoint
        host: 'custom-domain.tld'
    })
    .chart({/* chart.js configuration object */})
    .icretina('1') // enable paid-only features like high-resolution charts
    .toURL(); // get the whole (HMAC signed) URL

console.log(chart_url);
// https://image-charts.com/chart.js/2.8.0?icac=documentation&chart=%7Btype%3A%27line%27%2Cdata%3A%7Blabels%3A%5B%27January%27%2C%27February%27%2C%27March%27%2C%27April%27%2C%27May%27%2C%27June%27%2C%27July%27%5D%2Cdatasets%3A%5B%7Blabel%3A%27Unfilled%27%2Cfill%3Afalse%2CbackgroundColor%3A%27rgb%2854%2C+162%2C+235%29%27%2CborderColor%3A%27rgb%2854%2C+162%2C+235%29%27%2Cdata%3A%5B-73%2C40%2C-4%2C27%2C26%2C53%2C-12%5D%7D%2C%7Blabel%3A%27Dashed%27%2Cfill%3Afalse%2CbackgroundColor%3A%27rgb%2875%2C+192%2C+192%29%27%2CborderColor%3A%27rgb%2875%2C+192%2C+192%29%27%2CborderDash%3A%5B5%2C5%5D%2Cdata%3A%5B99%2C-40%2C93%2C-56%2C0%2C25%2C45%5D%7D%2C%7Blabel%3A%27Filled%27%2CbackgroundColor%3A%27rgb%28255%2C+99%2C+132%29%27%2CborderColor%3A%27rgb%28255%2C+99%2C+132%29%27%2Cdata%3A%5B56%2C68%2C84%2C11%2C-96%2C-56%2C-51%5D%2Cfill%3Atrue%7D%5D%7D%2Coptions%3A%7Btitle%3A%7Bdisplay%3Atrue%2Ctext%3A%27Chart.js+Line+Chart%27%7D%2Cscales%3A%7BxAxes%3A%5B%7Bdisplay%3Atrue%2CscaleLabel%3A%7Bdisplay%3Atrue%2ClabelString%3A%27Month%27%7D%7D%5D%2CyAxes%3A%5B%7Bdisplay%3Atrue%2CscaleLabel%3A%7Bdisplay%3Atrue%2ClabelString%3A%27Value%27%7D%7D%5D%7D%7D%7D&bkg=white&width=700&height=390&icretina=1&ichm=f272aa90e5ec691d41ac6c6c541f9d114c09dd38a1c7f114745c00074da72f69
c( value ) : ChartJSImageJavascript/JSON definition of the chart. Use a Chart.js configuration object.
.c("{type:'bar',data:{labels:['Q1','Q2','Q3','Q4'],datasets:[{label:'Users',data:[50,60,70,180]},{label:'Revenue',data:[100,200,300,400]}]}}")
chart( value ) : ChartJSImageJavascript/JSON definition of the chart. Use a Chart.js configuration object.
.chart("{type:'bar',data:{labels:['Q1','Q2','Q3','Q4'],datasets:[{label:'Users',data:[50,60,70,180]},{label:'Revenue',data:[100,200,300,400]}]}}")
width( value ) : ChartJSImageWidth of the chart
.width("400")
height( value ) : ChartJSImageHeight of the chart
.height("300")
backgroundColor( value ) : ChartJSImageBackground of the chart canvas. Accepts rgb (rgb(255,255,120)), colors (red), and url-encoded hex values (%23ff00ff). Abbreviated as "bkg"
.backgroundColor("black")
.backgroundColor("rgb(255,255,120)")
.backgroundColor("%23ff00ff")
bkg( value ) : ChartJSImageBackground of the chart canvas. Accepts rgb (rgb(255,255,120)), colors (red), and url-encoded hex values (%23ff00ff). Abbreviated as "bkg"
.bkg("black")
.bkg("rgb(255,255,120)")
.bkg("%23ff00ff")
encoding( value ) : ChartJSImageEncoding of your "chart" parameter. Accepted values are url and base64.
.encoding("url")
.encoding("base64")
icac( value ) : ChartJSImageimage-charts enterprise
account_id
.icac("accountId")
ichm( value ) : ChartJSImageHMAC-SHA256 signature required to activate paid features
.ichm("0785cf22a0381c2e0239e27c126de4181f501d117c2c81745611e9db928b0376")
icretina( value ) : ChartJSImageretina mode
.icretina("0")
.icretina("1")
FAQs
Render Chart.JS as Image (or URL of Image)
We found that node-image-chart-js demonstrated a not healthy version release cadence and project activity because the last version was released a year ago. It has 1 open source maintainer collaborating on the project.
Did you know?

Socket for GitHub automatically highlights issues in each pull request and monitors the health of all your open source dependencies. Discover the contents of your packages and block harmful activity before you install or update your dependencies.
Product
Socket for Jira lets teams turn alerts into Jira tickets with manual creation, automated ticketing rules, and two-way sync.

Company News
Socket won two 2026 Reppy Awards from RepVue, ranking in the top 5% of all sales orgs. AE Alexandra Lister shares what it's like to grow a sales career here.

Security News
NIST will stop enriching most CVEs under a new risk-based model, narrowing the NVD's scope as vulnerability submissions continue to surge.