react-native-range-chart
Description
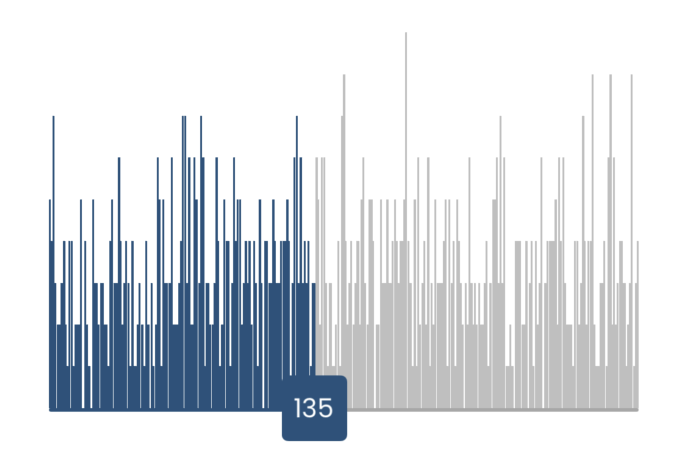
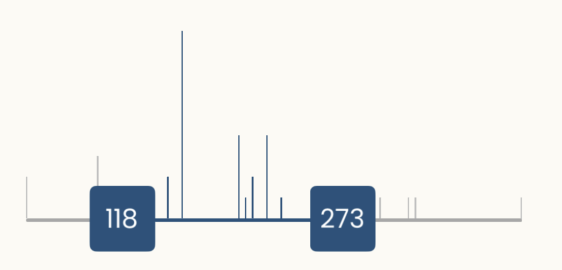
react-native-range-chart is a versatile range slider component for React Native, which includes a range slider with one or two handles and an integrated column chart. The column heights represent the frequency of occurrences, making it easy to visualize data distribution within a defined range.
Installation
To install the package, run:
npm i react-native-range-chart
Usage
Here’s a basic example of how to use the RangeChart component:
import RangeChart from 'react-native-range-chart';
const YourComponent = () => {
const dataArray = [
{ value: 10, count: 2 },
{ value: 15, count: 5 },
{ value: 20, count: 3 },
];
const handleRangeChange = (newRange) => {
console.log('Selected Range:', newRange);
};
return (
<RangeChart
dataArray={dataArray}
minRange={0}
maxRange={30}
maxHeight={200}
containerWidth={350}
compareWith="value"
initialValues=[30,70]
onRangeChange={handleRangeChange}
/>
);
};
For a single-handle slider, set initialValues as e.g. [5]. For a double-handle slider, set initialValues as [4,7].
Props
| Prop | Type | Description |
|---|
| dataArray | Array | Array of objects with data points, each containing a value to display on the chart and an occurrence count. |
| minRange | Number | Minimum value for the range slider. |
| maxRange | Number | Maximum value for the range slider. |
| maxHeight | Number | Maximum height for the column chart, adjusting based on occurrence frequency. |
| containerWidth | Number | Width of the chart container. |
| compareWith | String | Key in the data array to compare values with. |
| initialValues | Array | Initial values for the range slider; specify [5] for one handle, [5,10] for two handles. |
| onRangeChange | Function | Callback function that returns the selected range. |
License
This project is licensed under the MIT License.
Contact
For more information, please reach out to the developer at usman.khalid444@gmail.com