Security News
vlt Launches "reproduce": A New Tool Challenging the Limits of Package Provenance
vlt's new "reproduce" tool verifies npm packages against their source code, outperforming traditional provenance adoption in the JavaScript ecosystem.
visual-tree
Advanced tools
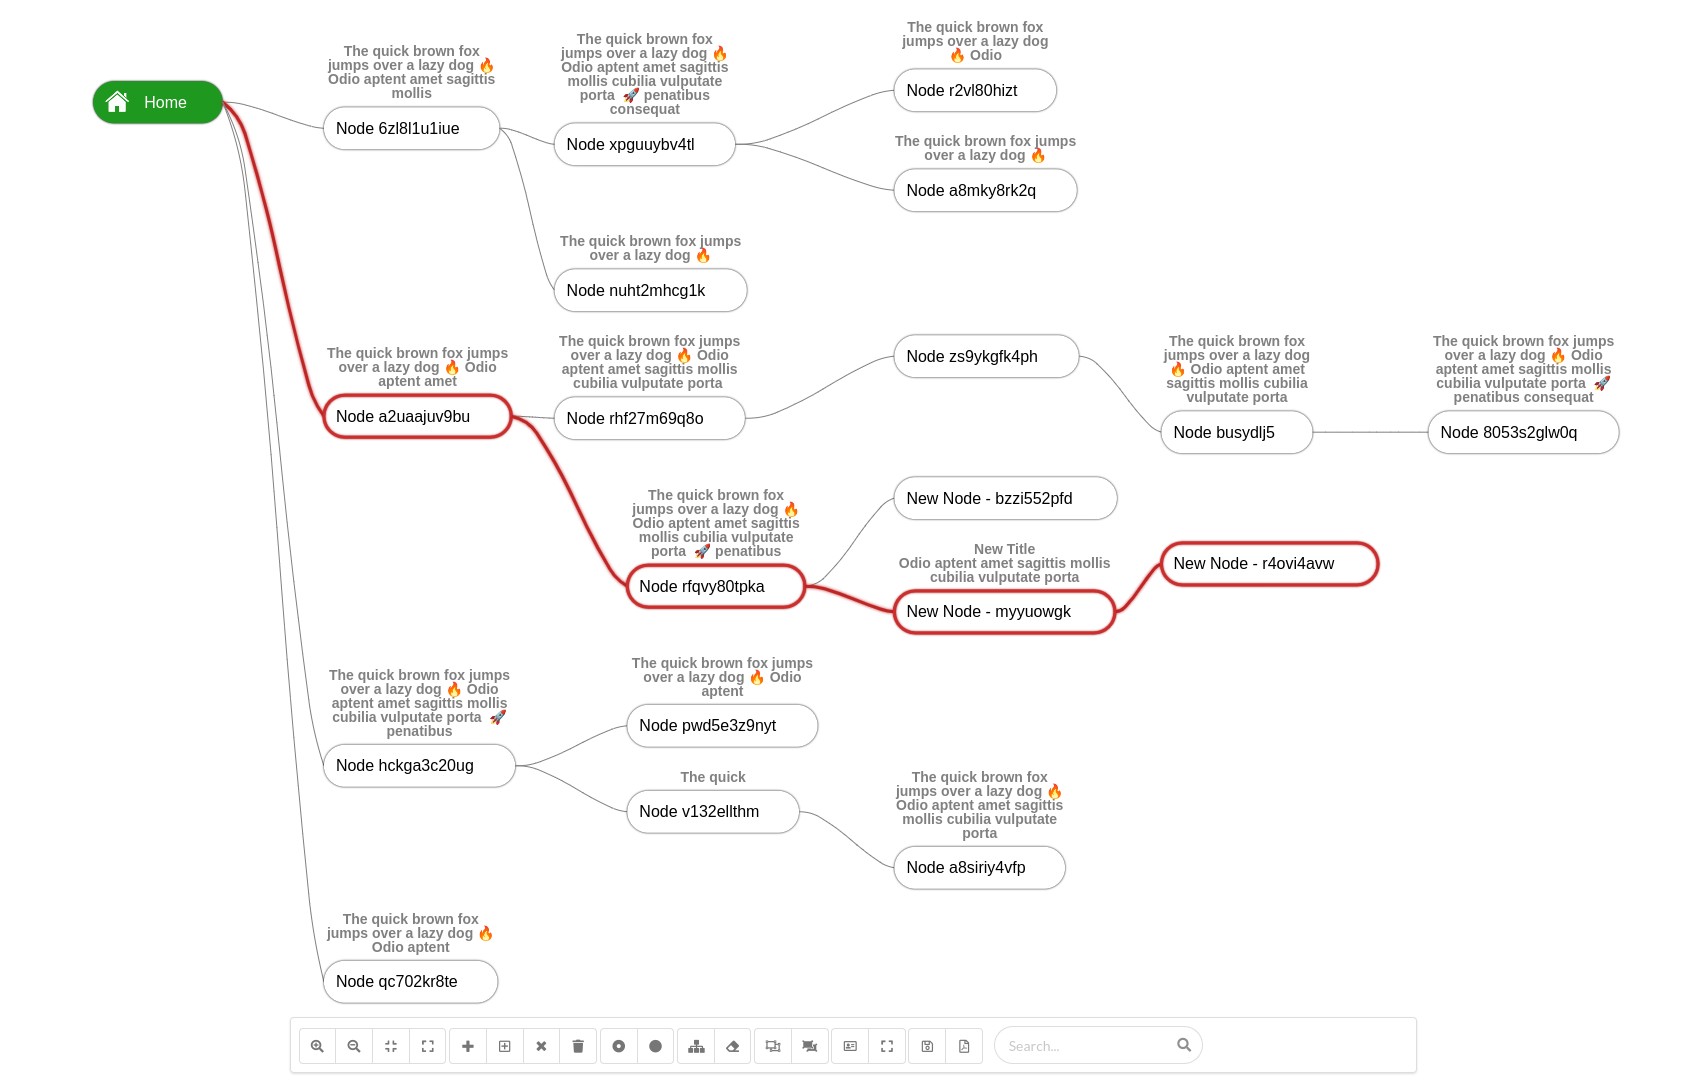
A basic interactive tree visualization library that can be used to render different types of tree structures.
https://user-images.githubusercontent.com/2601749/214102138-84f599e7-630a-4abf-adc9-94fd77593bb2.mp4

npm install visual-tree --save
A tree visualization displays hierarchical data with a collection of nodes (data points that can store value or whole object) and edges (hierarchical relations between nodes).

div element with specific id to be used as canvas container<div id="visual-tree-container"></div>
// Create visual tree instance
var element = document.getElementById("visual-tree-container");
var visualTree = new VisualTree(element);

// Create new Nodes
var root = new Node({
    id: "0",
    name: "Home",
    icon: '/public/assets/home.png',
    textColor: '#ffffff',
    backgroundColor: '#1e981e'
});

var node = new Node({
    id: "1",
    name: "Child Node"
});

// Add nodes
visualTree.add(root);
visualTree.add(node, root);

// Finally render tree
visualTree.render();
// Zoom in
visualTree.zoomIn();
// Zoom out
visualTree.zoomOut();
// Zoom fit
visualTree.zoomFit();
// Zoom reset (Scale 1 and center in viewport)
visualTree.zoomReset();
// Toggle fullscreen
visualTree.toggleFullScreen();
// Get selected node
var selected = visualTree.selectedNode;
// Select node by id
visualTree.selectNode("12");
// Reset selection
visualTree.resetSelection();

// Highlight node
node.highlighted = true;
// Reset all nodes highlight
visualTree.resetHighlight();

// Add child node to parent A
visualTree.add(new Node({id: "1", name: "child"}), A);
// Insert node between node "A" as parent and "B" as a child
visualTree.add(new Node({id: "1", name: "child"}), A, B);

// Remove single node
visualTree.remove(selected, false);
// Remove node with its children
visualTree.remove(selected, true);

// Show node within viewport
visualTree.panToNode(node);
// Select edges between start and end nodes
visualTree.selectPath(startNodeId, endNodeId);
// Reset edges selection
visualTree.resetPathsSelection();
We can highlight edges path between 2 nodes, and the library will traverse the tree between nodes to select the edges.
selectPath and pass start node id and end node idresetPathsSelection function.visualTree.selectPath(root.id, endNode.id);
// To reset highlight
visualTree.resetPathsSelection();
function searchForNodes(term) {
    if(term.length === 0) {
        // Reset current highlighted nodes
        return visualTree.resetHighlight();
    }

    // Very basic search method
    // You can implement whatever you need
    Object.values(visualTree.nodes).forEach((node) => {
        if(node.name.indexOf(term) >= 0) {
            node.highlighted = true;
        } else {
            node.highlighted = false;
        }
    });
}
// Show/Hide collapse and expand button (Toggle Button)
visualTree.setToggleButtonVisibility(false); // default = true
visualTree.setOnMouseMoveEvent((e) => {
    // Get current node (Node intersects with mouse current position x,y)
    const node = e['node'];

    // Show action button on current hovered node under mouse position
    if(node != null) {
        tree.setActionButtonVisibility(true, node);
    } else {
        tree.setActionButtonVisibility(false);
    }
});
We have used the Reingold-Tilford tree visualization algorithm.
With current implementation and use case, we need to draw on x-axis, so we have done the implementation accordingly, the main challenge here is to determine the Y position for each node, also we have variable width and height for nodes, so we've also added some optimizations, for example, to get max-width for each column (along y-axis) and adjusted node X positions accordingly.
Additional details:
For canvas rendering we use a low-level library Konva.js which helps focus on functionalities we need without wasting time with canvas and shape low-level rendering details.
Konva.js is an HTML5 2d canvas js library for desktop and mobile applications that can work with ES5, ES6, or even Typescript.
Additional details:
Keyboard navigation is implemented through considering the tree as a virtual grid (rows, columns) then move along the y-axis using up and down arrows, or along the x-axis using right and left arrows.
MIT
FAQs
Visual Tree
The npm package visual-tree receives a total of 0 weekly downloads. As such, visual-tree popularity was classified as not popular.
We found that visual-tree demonstrated a not healthy version release cadence and project activity because the last version was released a year ago. It has 1 open source maintainer collaborating on the project.
Did you know?

Socket for GitHub automatically highlights issues in each pull request and monitors the health of all your open source dependencies. Discover the contents of your packages and block harmful activity before you install or update your dependencies.

Security News
vlt's new "reproduce" tool verifies npm packages against their source code, outperforming traditional provenance adoption in the JavaScript ecosystem.

Research
Security News
Socket researchers uncovered a malicious PyPI package exploiting Deezer’s API to enable coordinated music piracy through API abuse and C2 server control.

Research
The Socket Research Team discovered a malicious npm package, '@ton-wallet/create', stealing cryptocurrency wallet keys from developers and users in the TON ecosystem.