Security News
vlt Launches "reproduce": A New Tool Challenging the Limits of Package Provenance
vlt's new "reproduce" tool verifies npm packages against their source code, outperforming traditional provenance adoption in the JavaScript ecosystem.
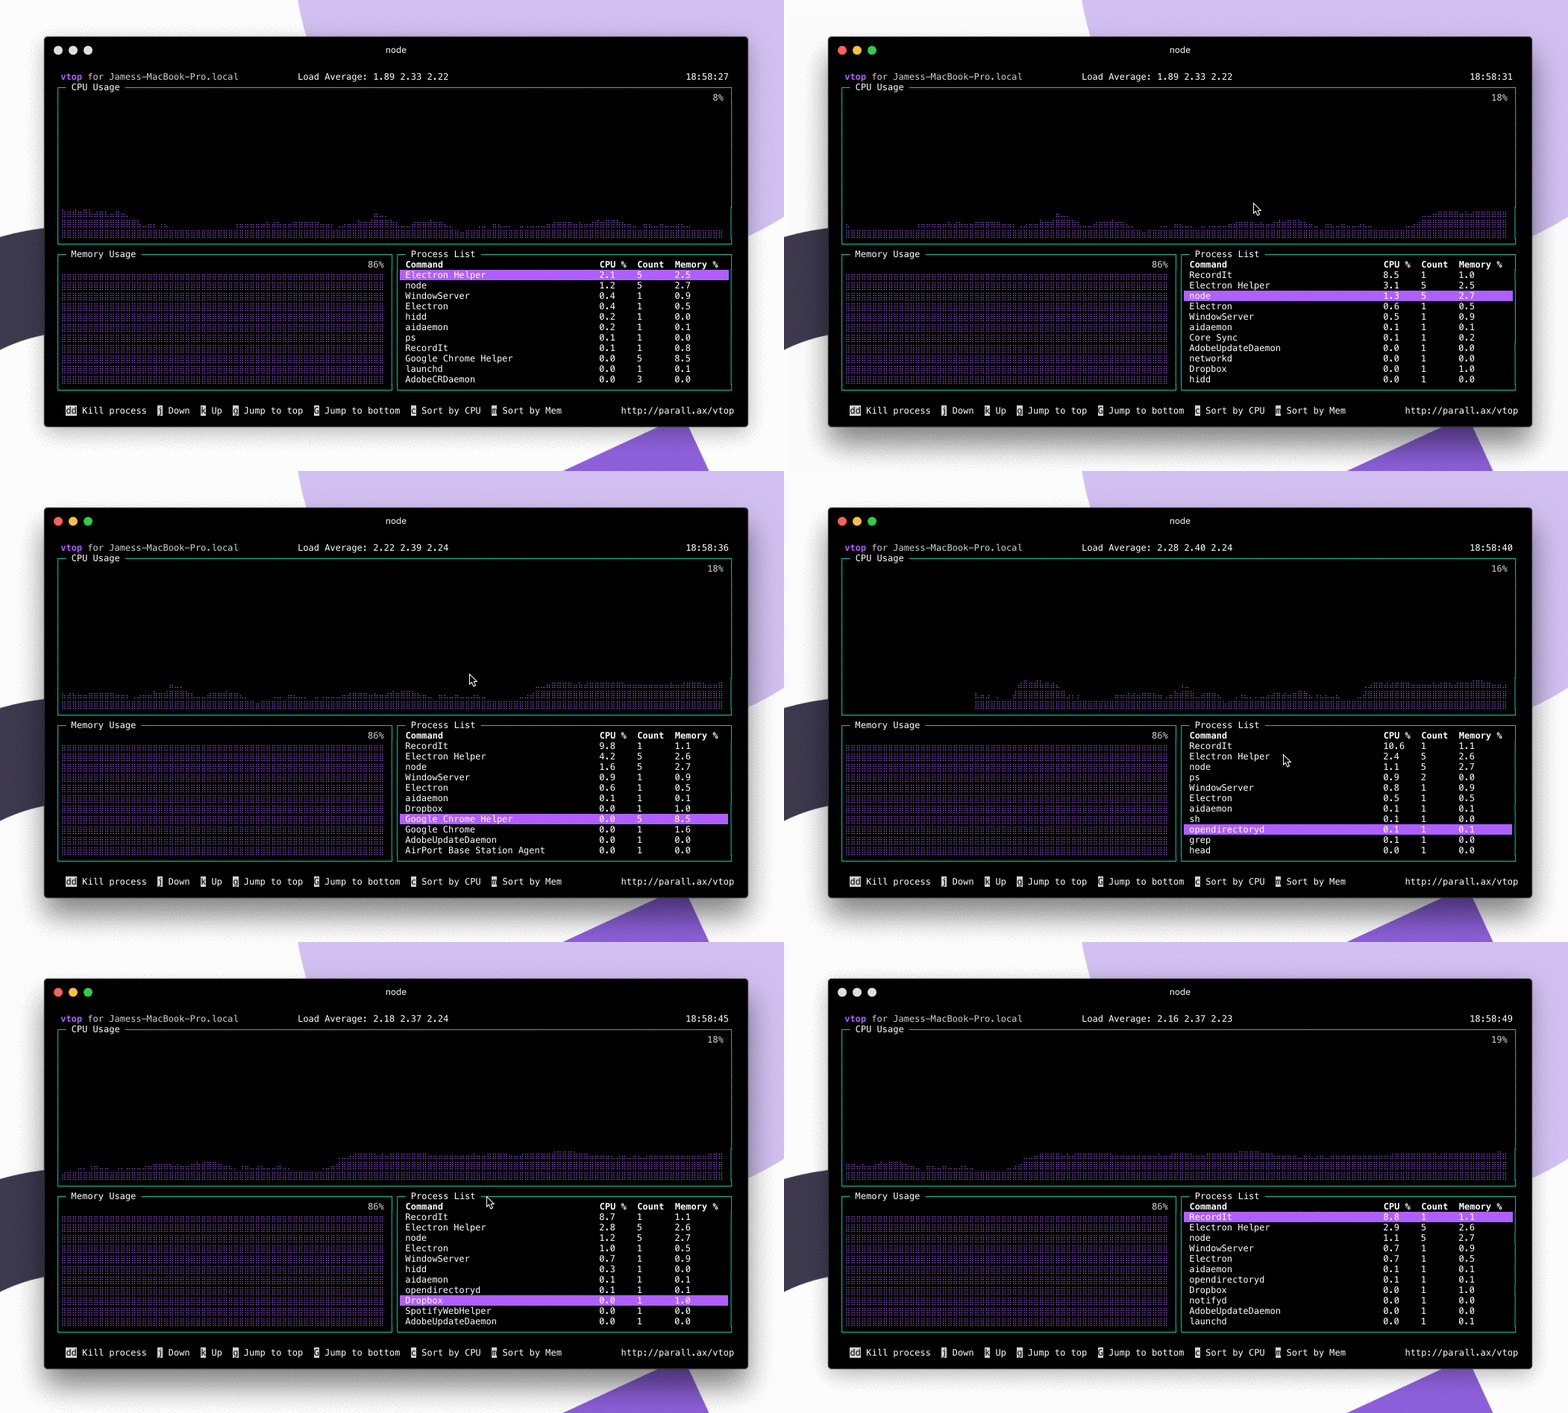
A graphical activity monitor for the command line. Written in node.js.

If you haven't already got Node.js, then go get it.
sudo npm install -g vtop
This is pretty simple too.
vtop
If your terminal supports mouse events (like iTerm) then you can click on the items in the process list. As well as use the scroll wheel.
It uses drawille to draw CPU and Memory charts with Unicode braille characters, helping you visualize spikes. We also group processes with the same name together.
We calculate the CPU percentage as a total of your overall system power. 100% is all cores and HyperThreads maxed out. This is different to how Apple Activity monitor works.
No I like it this way. Feel free to submit a PR with it as a config option though.
Sure, just do:
vtop --theme wizard
This loads the theme file in themes/ with the same name. Make your own and send me a Pull Request :)
You could add this to your aliases if you'd like to use it always.
alias vtop="vtop --theme brew"
Yeah that's on the list :) Feel free to send a pull request though. Check out the sensors/ folder.
MIT – do what you like with it :)
FAQs
Wow such top. So stats
The npm package vtop receives a total of 300 weekly downloads. As such, vtop popularity was classified as not popular.
We found that vtop demonstrated a not healthy version release cadence and project activity because the last version was released a year ago. It has 1 open source maintainer collaborating on the project.
Did you know?

Socket for GitHub automatically highlights issues in each pull request and monitors the health of all your open source dependencies. Discover the contents of your packages and block harmful activity before you install or update your dependencies.

Security News
vlt's new "reproduce" tool verifies npm packages against their source code, outperforming traditional provenance adoption in the JavaScript ecosystem.

Research
Security News
Socket researchers uncovered a malicious PyPI package exploiting Deezer’s API to enable coordinated music piracy through API abuse and C2 server control.

Research
The Socket Research Team discovered a malicious npm package, '@ton-wallet/create', stealing cryptocurrency wallet keys from developers and users in the TON ecosystem.